Pharmacies, Not Local Public Officials, May Ensure Race Equity in Vaccination Rates

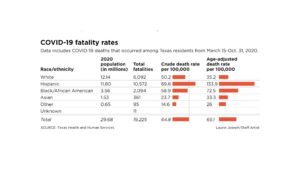
The release of a long-awaited report on Texas COVID-19 facilities by race-ethnicity was shocking.[1]Not because our community was unaware of race-ethnic disparities in vaccination rates but rather the large size of these disparities in Texas.  As the numbers for age-adjusted death rates per 100,000 revealed, Hispanics were nearly four times more likely to die (133.9) from the coronavirus than whites (35.2), while Blacks (72.5) were twice as likely to die as whites.  Asian death rates (33.3) were slightly lower than whites.

Texas State Rep. Shawn Thierry along with other lawmakers have been advocating for the release of this report in order to mobilize statewide efforts to target vulnerable groups like Blacks and Hispanics, although state officials have been reluctant to act more aggressively. In response to the release of this report, Rep. Thierry explained that the findings underscored the need to target resources to communities of color, especially since other data shows that white residents are getting vaccinated at higher rates than Blacks and Latinos. [2]

Given the high death rates for Latinos and Blacks, it is especially surprising that Texas state officials recently threatened to withhold vaccine doses that were allocated to Dallas County if they proceeded with a plan to target vaccinations to zip codes that included higher numbers of vulnerable Black and Latino residents.

Indeed, efforts to block targeted interventions to vulnerable communities contradicted recommendations by the National Academy of Sciences that recommended that “priority be given to ‘people who are considered to be the most disadvantaged or the worst off’ as defined by measures such as the Social Vulnerability Index created by the Centers for Disease Control and Prevention.” [3]

The announcement that the Biden administration will begin shipping vaccines to pharmacies throughout the U.S. was a major sight of relief for two reasons.  First, it minimizes the involvement of local politicians in the equitable distribution of the vaccines who have largely bungled the job in its communications, registration and distribution – resulting in higher vaccination rates of higher-income whites than lower-income Blacks and Latinos.  Texas politicians will also have less influence in threatening to withhold vaccines to jurisdictions that want to more aggressively vaccinate the more vulnerable communities of color.

Secondly, pharmacies are much easier to access for the elderly, Blacks and Latinos who encounter more barriers in registrations and obtaining vaccinations.  The Mega Centers are innovative in terms of providing a centralized location to vaccinate thousands of residents more rapidly; however, not all residents can travel to these Mega Centers or wait in line for hours during cold weather without access to restrooms or food.  The distribution of vaccines by pharmacies will not solve all the problems experienced thus far but should lead to significant improvements.

Given the gravity of the higher death rates for Texas Latinos and Blacks, it is disturbing to learn that Texas state officials are delaying any targeted interventions for these groups for several months.  Even more disturbing is that state officials threatened to withhold vaccine doses to Dallas County for attempting to follow the science by targeting the more vulnerable groups of Black and Latino zip codes.  The State of Texas deserves no praise for their callous response to the lives of its Black and Latino residents.


Reference Notes


[1]Morris, A.  (2021, February 2).  Report highlights disparities – but proposals targeting effects on minorities months away.  The Dallas Morning News, Accessed at: 

[2]Ibid.

[3]Cited in Warren, R.C. D.D.Sl, Dr.PH.H., M.Div., Forrow M.D., L., Hodge Sr., D.Min., Ph.D., and Truog, M.D., R.D.  (2020, November 26).  Trustworthiness before trust – COVID-19 vaccine trials and the Black community.  The New England Journal of Medicine.  Accessed at: https://www.nejm.org/doi/full/10.1056/NEJMp2030033      

Why Do Dallas-Area Public Officials Keep Fumbling the Ball on Programs Targeted to Multicultural Communities?

 Let’s give credit where credit is due. Dallas County and City of Dallas public officials have not won any accolades recently for decisions regarding programs that impact the quality of life for its multicultural community.The recent fiasco surrounding the distribution of the COVID-19 vaccine is the most recent example, but two other recent programs also come to mind – the Census 2020 Campaign and the lingering presence of food deserts in South DallasAs I will argue, these programs have one important thing in common that has posed a barrier to their success: the absence of quality research to guide decisions regarding public programs that are targeted to Black and Latino residents.

In 2020, I published a book entitled “The Culture of Research” that discusses the importance of conducting sound research in culturally and linguistically diverse communities and the consequences to decision making when such studies are missing or poorly conducted. Following are some insights derived from this book that should help the reader understand how sound research with multicultural communities could have produced improved outcomes in the management of the local COVID-19 vaccination program, the Census 2020 Campaign, and solving the mystery surrounding the persistence of food deserts in South Dallas.

COVID-19 Vaccine Awareness, Registration and Distribution

The local confusion and mismanagement associated with the COVID-19 vaccine distribution can be traced originally to the absence of guidance and transparency at the federal level, and the related decision by the previous administration to allow states to define their own independent strategies with a minimal financial support from the federal government.

Nonetheless, the COVID-19 vaccine distribution dilemma in Dallas County, Texas presents a good case study on decisions that public officials in urban communities should not make.   Indeed, the series of inconsistent and questionable decisions resulted in considerable public confusion and frustration with vaccine registrations, availability and distribution. Some of these missteps included the following:

  • Contradictory messages from county and city public officials;
  • Over-reliance on an Internet strategy to inform and register residents, many who lacked online access or own a computer, or were not comfortable with technology;
  • Inconsistent support in Spanish and other languages;
  • Placement of testing and vaccination sites in higher income while providing limited access in the more vulnerable areas; and  
  • Transportation barriers that prevented some residents to travel to testing or vaccination sites.
These missteps have resulted in higher numbers of white, higher-income residents getting vaccinated rather than the targeted, more vulnerable Black and Latino residents in the lower-income areas of South and Northwest Dallas. 

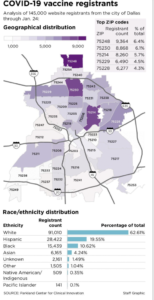
Figure 1:

Figure 1, published recently in The Dallas Morning News, clearly illustrates this pattern: [1]  whites comprised 62.2 percent of all persons vaccinated while representing 28.2% of the County population; Hispanics represented 19.5 percent of those vaccinated while comprising 40.8% of the population; and Blacks comprised 10.6 percent of those vaccinated although they represented 22.3% of the county population.  These disparities persist despite recent efforts by public officials to communicate more directly with civic leaders, churches and community organizations to improve vaccination rates for Blacks and Latinos in the South and Northwest part of Dallas.

The problem associated with vaccine distribution in communities of color is deeply concerning because they are the most likely to experience the more serious medical consequences from the coronavirus.  Importantly, these missteps in decision making could have been avoided with communications that were better coordinated by public officials and engagement of experts with significant experience engaging multicultural persons. 

The decision to use an Internet vehicle for the vaccination campaign is very likely the reason that white, higher income residents continue to be more successful in getting vaccinated. Although some public officials supported the idea of targeting zip codes in South Dallas that included some of the most vulnerable Black and Latino residents, the Texas State Health Department[2]immediately issued a threat to withhold vaccine doses allocated to Dallas County if the targeting was implemented.  This threat was a direct contradiction to recommendations by the National Academy of Sciences that support vaccine community intervention programs that are targeted to the most vulnerable communities. [3]  Thus, Dallas County and City of Dallas public officials learned the hard way that launching a public vaccination program in linguistically and culturally diverse communities require less reliance on technology and more reliance on outreach efforts that take the vaccines to the residents.  Ironically, while the state threatened to withhold vaccine doses if local officials employed a zip-code targeting approach in South Dallas, the use of an Internet strategy as the primary form of communication accomplished the same outcome by vaccinating higher numbers of white, higher-income residents who resided in the northern parts of Dallas County.

South Dallas Food Deserts

Why have mainstream supermarkets avoided South Dallas food deserts that are populated by lower-income Blacks and Latinos?  [4]This question inspired me to conduct a geospatial analysis using crime, demographic and supermarket expenditure data to examine the common reasons cited by supermarket executives to explain the avoidance of communities like South Dallas – such as high crime, low population density, lower household median income and insufficient food expenditures.  The study revealed that crime patterns were often inflated by previous investigators and news stories, and that the annual food-at-home expenditures in several food deserts in South Dallas were adequate to sustain the annual sales of a mainstream supermarket.  Flawed crime analyses, stereotypes of urban retail, and an apparent disdain for Black and Latino customers appeared to drive site selection decisions in South Dallas.

Over the past two decades, the City has floundered millions of taxpayer dollars on ill- conceived investments that failed to produce positive changes in the supermarket options for this community. Worst yet, a market demand study of community residents – a traditional practice to measure supermarket opportunities — has never been conducted in South Dallas. Such a study would have provided supermarket and site selection executives the statistical evidence needed for an investment decision. In the meantime, South Dallas residents will be forced to continue shopping outside of their community for healthy, affordable food or visit the less desirable dollar stores.  Once City public officials decide that the South Dallas community is deserving of a high-quality supermarket experience, a professional, high quality market demand study is the best approach for making this a reality.  If supermarket redlining practices continue in South Dallas despite solid evidence of its retail potential, it might be a good idea to recruit a supermarket chain from outside of Dallas County or Texas that reveals a greater interest in serving Black and Latino consumers in urban communities. 

The Census 2020 Campaign

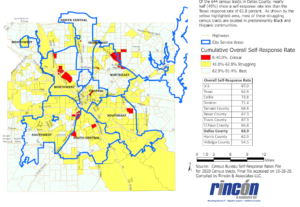
In January 2020, Dallas County and the City of Dallas funded a $1.9 million Census 2020 Campaign to provide a comprehensive strategy to boost response rates in hard-to-count communities that were populated by lower-income Blacks and Latinos. The team selected to conduct the campaign submitted a report summarizing the multitude of campaign activities that they conducted from February to August of 2020 to target these HTC communities.  To monitor progress on this campaign, I produced maps on a monthly basis that illustrated the cumulative self-response rates by census tracts that were provided by the Census Bureau.  Figure 2 below shows that the final self-response rates reported by the Census Bureau were decidedly lower in the southern and northwest parts of the city where HTC Blacks and Latinos resided.  In fact, the table of Overall Self-Response Rates indicates that Dallas County ended with one of the lowest self-response rates (63.9%) compared to other large Texas counties.  Consequently, the Census Bureau was required to deploy many more field interviewers in order to minimize the potential population under-count, an especially difficult task during the pandemic.  Despite its best intentions, the Census 2020 Campaign funded by the County and City appeared to fall short of its intended goal in hard-to-count communities and will likely lead to the loss of millions of federal dollars for local programs. Although the pandemic posed a barrier to response rates during this period, the burden on Dallas County was likely similar for all other counties considered here.

                 Figure 2: Dallas County 2020 Self-Response Rates by Census Tract and City Service Area

Part of the challenge in completing the Census 2020 questionnaires can be traced to the reliance that the Census Bureau placed on using an online survey as their major data collection strategy. In past censuses, the Census Bureau relied primarily on a mail questionnaire, while data collection for the annual American Community Survey has utilized a mixed mode strategy that included mail questionnaires, telephone interviews, personal interviews and online surveys.  Not surprisingly, Black and Latino respondents to the American Community Survey have opted for telephone and personal interviews more often than whites or Asians, while online surveys were the least chosen option.

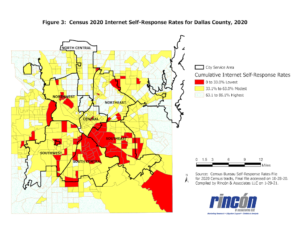
Figure 3 below presents the percentage of Dallas County households that completed the Census 2020 using an online survey.  The map presents the cumulative Internet self-response rates for the 2020 Census as of October 28, 2020.  Of the seven City Service Areas (CSAs), the Central, Southeast, South Central, Southwest and Northwest CSAs are populated primarily by lower income Blacks and Latinos. It is clear that these CSAs included census tracts (highlighted in red) with the lowest online response rates, while the numerous other census tracts (highlighted in yellow) showed modest online response rates.  The highest online return rates were realized for census tracts in the northeast and north central CSAs that were populated primarily by white, higher-income residents.


Throughout 2020, public officials in Dallas County and City of Dallas were aware of the poor performance of the Internet to encourage poor Blacks and Latinos to complete the 2020 Census.  Why then was the Internet the main vehicle used for communications related to COVID-19 vaccine awareness, registration and distribution?  Good research and multicultural expertise would have been beneficial to decision makers during this period.

Based on my past 45 years of experience in conducting surveys of multicultural populations, it is my opinion that the Census 2020 Campaign sponsored by Dallas County and City of Dallas was not guided by the best expertise regarding the strategies for successfully engaging multicultural population segments in surveys and the biennial census.  If it had been, Dallas County might have experienced a higher ranking in Census self-response rates in comparison to the many Texas counties that did not allocate any funding for a Census 2020 campaign.

Some Concluding Thoughts 

The challenges facing public officials to ensure a satisfactory quality of life for all community residents have become more complex and will require careful planning using the best expertise in understanding and engaging culturally and linguistically diverse communities.  Public officials must resist the temptation to take the path of least resistance by overlooking or dismissing the need for solid research to guide decisions that impact the quality of life of multicultural residents. Dallas County and City of Dallas public officials learned the hard way that engaging culturally and linguistically diverse residents is a complex task that requires multicultural expertise and support from community organizations. As the population of urban areas like Dallas County continues to grow and evolve demographically, the challenges to respond more effectively to important community needs and events will become more challenging.  Let’s hope that public officials will be better prepared to respond.


Reference Notes

[1] Garcia, N. and Jimenez, J. (2021, Jan. 28).  White Dallas residents outpace Blacks, Hispanics in registering for COVID vaccine.  Dallas Morning News, Accessed at:  https://www.dallasnews.com/news/public-health/2021/01/29/white-dallas-residents-outpace-blacks-hispanics-in-registering-for-covid-vaccine/

[2] Choi, J. (2021, Jan. 21).  Texas threatened to reduce vaccine supply to Dallas County over plan to focus on ‘vulnerable’ ZIP codes.  The Hill.   Accessed at: https://thehill.com/homenews/state-watch/535294-texas-threatened-to-reduce-vaccine-supply-to-dallas-county-over-plan-to

[3]National Academy of Sciences, Engineering and Medicine (2020). Framework for equitable allocation of COVID-19 vaccine. Washington, D.C.: National Academy Press.

[4] Rincón, E.T. and Tiwari, C. (2020, March 23). Demand metric for supermarket site selection:
 A 
case study. Papers in Applied Geography,  Accessed at: https://doi.org/10.1080/23754931.2020.1712555

Careless Decision Making Creates Race-Ethnic Disparities in Distribution of COVID-19 Vaccine


The recent story in The Dallas Morning News was clear and disturbing: 

”COVID vaccines at Fair Park aren’t going to Black, Latino residents as officials hoped” [1] 

The story chronicles the missteps in public communications efforts to schedule large-scale vaccinations to historically disenfranchised neighborhoods, which are mostly Black and Latino and below Interstate 30 – groups that have experienced a higher number of illnesses, hospitalizations and mortalities during the pandemic.  Instead, however, the thousands of residents that showed up for the vaccinations at Fair Park were mostly white North Texans from higher-income neighborhoods following mixed messages to the public – many showing up in their Mercedes, Infiniti and BMW automobiles. 

Dallas City Mayor Eric Johnson blamed County Judge Clay Jenkins for the confusion generated by the announcement to register online with the county to receive a vaccine appointment at the South Dallas Mega Center – an announcement that was apparently not coordinated with the Mayor’s office. Word of mouth spread rapidly that an appointment was not needed for residents 75 and older – which left thousands of others on a waiting list and encouraged many out-of-town residents to show up for a vaccine.  County officials pointed out that a significant number of residents who showed up were able to access an unsecured web link that allowed them to book an appointment, regardless of age or status.  Other residents who showed up also pointed to emails received from the county encouraging them to sign up for an appointment.

Interestingly, Dallas County was not prepared to release a demographic profile of those that received vaccinations, a report that would have been very useful in evaluating the extent of the exclusion of more deserving Black and Hispanic residents in the targeted community.  As an apparent after-thought to expand access to the intended Black and Hispanic residents,  Jenkins and his staff began reaching out to leaders in those communities, including elected officials, faith leaders and other organizations that work in communities where the coronavirus was most prevalent.

The vaccine distribution fiasco in Dallas County is not an isolated one as many communities throughout the U.S. are struggling to coordinate the vaccinations using a confusing set of federal guidelines that are implemented inconsistently thoughout the nation.  In a previous blogpost, I had warned about potential problems that could complicate the distribution of the vaccines once they became available.  For example:

·        The Center for Disease Control decided to exclude Blacks and Hispanics from the category of “high-risk” groups, thus reducing their priority level for intervention strategies. Why?  Because the CDC concluded that the high virus rates are not due to genetics, and they want to avoid stigmatizing these groups as “COVID carriers.” [2]

·        Race-ethnic information is missing for many of the cases, hospitalizations and mortalities recorded for COVID-19, which obscures the accurate reporting of this information for Black and Hispanic communities – a consequence of lax mandates for recording race-ethnic information. The absence of this information obscures the true picture of community spread of the virus. [3]

·        Access to testing sites in states like Texas is problematic since these sites are more commonly located in white communities than the more vulnerable Black and Hispanic communities. [4]

It is also disturbing to learn that states like Florida have relaxed the requirements for vaccine eligibility by allowing anyone over the age of 65 years to obtain a vaccine, which has encouraged many tourists and out-of-town residents to drain the vaccine supplies at the expense of more deserving local residents.

In the case of Dallas County and the City of Dallas, it was unfortunate that better coordination was not in place to implement such an important vaccine intervention program at the Fair Park Mega Center.  However, even if the communications had been better coordinated, there is still one important tactical decision that could have produced a different outcome.

In my opinion, it was a major mistake to rely primarily on a web-based strategy to encourage Black and Latino residents in the targeted communities to register for the Mega Center vaccination. From their recent experience to encourage response rates to the Census 2020, both Dallas County and City of Dallas officials were aware that Black and Latino residents, especially immigrants, were excluded in large numbers from completing the Census questionnaire which also primarily relied on the Internet.  Our past research in multicultural communities confirms that Blacks and Hispanics are more likely to respond by telephone, mail and personal contacts when completing surveys and Census questionnaires but least likely to respond by using the Internet. Lastly, a Census population pyramid easily illustrates that a much larger proportion of whites are concentrated in ages 65 and older than Hispanics or Blacks – which would provide whites a distinct advantage when using eligibility criteria based on age alone.

For damage control, Jenkins reportedly began outreach to community elected officials, faith leaders and other organizations in the targeted zip codes – an approach that should have been followed initially. Whether by intent or just careless decision-making, Mr. Johnson was correct in stating that the county was “promoting a system that gave preferential treatment” – that is, to white, higher-income residents who were not the intended target audience of the Mega Center.

With COVID-19 vaccinations, there is less room for error in the fair distribution of a life-saving solution.  Let’s hope that public officials agree to improve the coordination of public vaccination campaigns by improving their communication strategies in culturally diverse communities.


Reference Notes


[1]Garcia, N. and Bailey, E. (2021, January 14). COVID vaccines at Fair Park aren’t going to Black, Latino residents as hoped.  The Dallas Morning News.  Accessed at: https://www.dallasnews.com/news/public-health/2021/01/14/dallas-mayor-eric-johnson-blasts-county-after-walkups-allowed-at-covid-19-vaccine-mega-site/

[2] Rincon, E.T. (2020, July 30) CDC blunders in excluding communities of color among high risk groups for COVID-19. https://www.rinconassoc.com/cdc-blunders-in-excluding-communities-of-color-among-high-risk-groups-for-covid-19

[3] Rincon, E.T. (2020, April 16). Missing race-ethnicity data complicates COVID-19 mortality counts, but the solution is simple. Accessed at: https://www.rinconassoc.com/missing-race-ethnicity-data-complicates-covid-19-mortality-counts-but-the-solution-is-simple

[4]Fanning, R. (2020, May 29). Across Texas, black and Hispanic neighborhoods have fewer coronavirus testing sites. Texas Standard. Accessed at: https://www.texasstandard.org/stories/across-texas-black-and-hispanic-neighborhoods-have-fewer-coronavirus-testing-sites/

Final Post-Mortem on the Texas Latino Vote in the 2020 Election
 

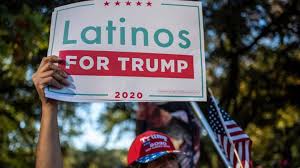
In the several post-mortems of the 2020 election, one key question has remained unanswered:  Are Latino voters really embracing Donald Trump — the same guy that referred to Latinos  as rapists and criminals, separated immigrant children from their families, accused of sexually assaulting several women, and referred to soldiers who lost their lives in battle as “suckers and losers”?  Because Trump was able to capture a higher percentage of Latino votes in Florida and South Texas compared to the 2016 election – various journalists and political pundits signaled an alarm bell suggesting that the future of the Democratic Party in Texas and Florida was in peril. 

It is curious that these limited Trump victories were portrayed as an  existential crisis for the Democratic Party, especially in light of CNN exit polls showing that U.S. Latinos  overwhelmingly supported Biden (66%) over Trump (32%) [1] — an outcome, by the way, that matched Latino support for Hillary Clinton in 2016. The following statements illustrate the warnings that accompanied Trump’s victory in South Texas:

“That erosion in an area considered a Democratic stronghold – is a warning sign to the party as it tries to flip the state.  It also serves as a stark reminder that the Latino vote is diverse, especially in a state like Texas. And that Democrats cannot take it for granted.” [2]

“And Trump, instead of being a complete drag on Cornyn, turned in eye-popping numbers in heavily Hispanic counties in South Texas.” [3]

“…such Hispanics joined conservative voters in urban and suburban areas to ‘deliver the message that life, liberty, law and order, Texas values and our Second Amendment rights are their top priority.” [4]

Especially interesting were the various attempts to explain the motivations for Trump’s newly found success among Latino voters in South Texas and Florida. To explore these motivations, reporters from the New York Times,[5] CNN [6] and Dallas Morning News [7] captured a variety of subjective impressions, or theories, from interviews with local legislators, community leaders, academics, and Hispanic voters. Following are seven distinct “theories” expressed by these stakeholders as justification for supporting Donald Trump along with factual information that we believe casts some doubt on these theories.

·       The Jobs Theory:  Concerns were raised that abolishing ICE would hit home to many Latinos that worked in homeland security and as Border Patrol agents, and also threaten jobs in the oil and gas industry. However, a 2019 report on the South Texas economy issued by the Texas State Comptroller’s Office [8] reported the following employment picture: (a) the number of jobs in South Texas related to justice, public order and safety activities were 29,654, representing 2.9 percent of all jobs in the region, (b) the four military installations in the region provided 41,044 jobs which represented 6.5 percent of all military jobs in Texas, and (c) 4,794 jobs or 0.57 percent of all jobs in the region were concentrated in the oil and gas or petroleum and coal products manufacturing industries. Taken together, these three industries accounted for a relatively small percentage (9%) of all jobs in the South Texas region.  Moreover, the oil and gas industry in Texas had already lost 51,000 jobs due to steep declines in demand and prices resulting from the pandemic that occurred under the watch of the Texas Republican administration.[9]  The large presence of military jobs may suggest a heightened sense of loyalty to the current president; however, did this sense of loyalty change when Donald Trump publicly disparaged military leaders, heroes and soldiers?

·       The Shared Values Theory: Some Latinos believed that Republicans shared similar values with Hispanic culture related to family, life and religious freedom. Trump’s family values are questionable given the numerous allegations of sexual assaults on women. And while Hispanics may value pro-life or anti-abortion policies, it is noteworthy that, according to a CDC 2016 report on statewide abortions,[10] Hispanic women nevertheless reported 20,667 abortions or 38.7 percent of all abortions in Texas. Regarding religious freedom, some Hispanics felt that Trump “brings God to our country” and values religious freedom.  Yet Trump has publicly voiced his intolerance for people of different religions, such as Muslims.

·       Communications Theory: Trump was described as a plain speaker. Indeed, Trump has managed to use plainly worded insults and profanity towards women, Latinos, Blacks, the disabled, athletes and war heroes. Trump also uses plain language when addressing public policy issues because his knowledge is very limited.

·       The Macho Theory: To some Hispanics, especially males, Trump’s macho style was appealing. Machos tend to be authoritarian and domineering, lack emotional investment, and believe that women should be subservient to males.  Considerable research, however, regarding Hispanic family dynamics confirms that Hispanic women are the primary decision-makers in the typical Hispanic household. [11]

·       The Exploited Theory: Several Hispanics believed that Democrats took them for granted while Republicans gave them a voice.  This theory has merit since the Democratic campaign in Texas was missing in action until the final week of the 2020 election, while Republicans launched aggressive campaigns in Florida and South Texas to capture the Latino vote.  Nonetheless, the South Texas region remains one of the poorest regions in Texas and has progressed little economically under the Republican leadership over the past decade.

·       Law and Order Theory: Trump was believed to support the police, law and order, and against defunding the police. But Trump publicly praises white supremacists and encourages supporters to use violence against Biden supporters and current government officials such as Michigan Gov. Gretchen Whitmer.  During the Trump administration, the number of hate crimes reported by the FBI have increased as well [12] [13]

·       Socialist Theory:  In Florida, Republicans utilized social media, outdoor parties and churches to promote the false message that Joe Biden was sympathetic to socialist dictators like Hugo Chavez and Fidel Castro – which Cubans and Venezuelans strongly disliked. Despite being false, however, the strategy was successful in creating stronger support for Trump in Florida.


While these theories are interesting, one should keep in mind that they are merely subjective impressions of Trump’s appeal that should not be generalized to Hispanics in South Texas, Florida or other communities.  Nonetheless, two disturbing attributes seem to emerge after reviewing these “theories:” a departure from reality and a distinct level of gullibility. That is, Latino Trumpers reveal a tendency to reject the facts related to an issue and seem easily deceived by the myths and distortions of the truth promoted by the Republican Party – attributes that are common among general Trump supporters. The gullibility attribute in Latinos stems from a general tendency to be more trusting of others than non-Latinos, although trust in government has clearly declined in recent years. Immigrants with limited English-speaking skills are more likely to trust Spanish-language media that they are better able to understand. Like the elderly, less acculturated Hispanics are less likely to be suspicious of the many scams and telemarketers that contact households on a daily basis and are often victimized according to annual fraud reports by the Federal Trade Commission.  During 2011, 13.4 percent of Hispanics were victims – almost 50 percent higher than the rate for non-Hispanic whites.  [14] Sadly, Spanish-language media is frequently used as the vehicle to victimize Hispanics, a practice that was successfully utilized by Republicans in Florida. Republican campaign strategists probably discovered these attributes early in the 2020 campaign and utilized it to their advantage in Florida, Texas and perhaps other communities. The ability to identify communities of Latinos that fit the Latino Trumperprofile is a clear advantage for the Republic Party, especially in communities that the Democratic Party chooses to ignore.

Despite these two victories, there is reason to believe that Biden did not lose Texas due to weak Latino support from the South Texas region.  To understand this point, let’s first review some basic information about the voting population in South Texas.

Profile of South Texas

To understand the voting outcomes in South Texas during the 2020 election, it is helpful to first understand some of the demographic and economic characteristics that distinguish this region from the state’s population. We will summarize some of the information provided in a summary report of the South Texas region by the Texas State Comptroller’s Office.[15]  The South Texas region includes 28 counties as shown by the yellow highlighted area in the following map (see Figure 1 below):
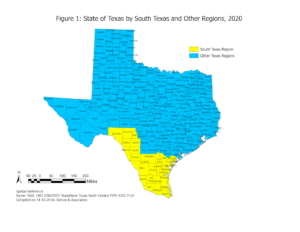
The 2019 estimated population for South Texas was 2.4 million, representing 8.4 percent of the total population in Texas.  Between 2010 and 2019, the region has grown more slowly (7.4% rate) than the state’s growth rate (15.3%). The region’s population is predominately Hispanic (83%), one of the poorest in the state with a per capita income of $31,965 compared to $50,355 for Texas, and has an unemployment rate nearly twice as high (5.3%) as Texas (3.5%).  The percentage of persons with a bachelor’s degree or higher in 2018 was decidedly lower in South Texas 17.8%) than the state (29.3%).  

Table 1 below shows the number of registered voters in Texas compared to South Texas.  The number of registered voters in South Texas represented less than 1 percent (0.6%) of the total number of registered voters in Texas. Due to its small number of registered voters, the South Texas region does not appear particularly influential in the 2020 presidential election.  

Table 1: Registered Voters by Regions, 2020

Geographic Area

Number

Percent

Texas

16,955,519

100.0

South Texas

103,833

0.6

Other Regions

16,851,686

99.4


Table 2 below shows that 11,071,502 million Texans voted during the 2020 election – a voter turnout of 65.3 percent. Of these total voters, 52.9 percent supported Donald Trump while 47.1 percent supported Joe Biden.  Compared to the state, support for Trump was slightly higher (54.4%) in South Texas..

Table 2:  Texas Votes Cast for Presidential Candidates, by State

and South Texas Region, 2020

Geographic Area

Total

Trump

Biden

Texas

11,071,502

5,860,096

5,211,406

Percent

100.0

52.9

47.1

South Texas

53,807

29,1 70

24,537

Percent

100.0

54.4

45.6

  Source: https://results.texas-election.com/county

Although it will be some time before we know the final votes cast in the 2020 election by race-ethnicity, a preliminary picture of the voting outcomes in Texas, Florida and Arizona were provided by CNN exit polls on election day. [16] An election exit poll is a poll of randomly selected voters that is taken immediately after they have exited a polling station. Exit polls can be affected by non-response bias, language bias, and clustering sampling methods that have been criticized for excluding Spanish-speaking voters who often vote for Democratic candidates.[17]  Table 3 below summarizes the results for Texas that included 4,768 voters.  Statewide Latino support for Joe Biden was higher (58%) than South Texas (45.6%) while statewide Latino support was lower for Donald Trump (41%) than South Texas (54.4%). Table 4 shows that in Florida the margins for Latino support were closer but still higher for Joe Biden (52%) than Donald Trump (47%).  Table 5 shows that in Arizona, Latinos strongly supported Joe Biden (63%) over Donald Trump (36%).

Table 3: Exit Poll Outcomes for Texas Presidential Candidates, 2020

(Percent)

Candidate

Race-Ethnicity of Voter

White

Black

Latino

Asian

Donald Trump

66

9

41

30

Joe Biden

33

90

58

63

Source:  CNN Exit Polls, n = 4,768


Table 4: Exit Poll Outcomes for Florida Presidential Candidates, 2020

Candidate

Race-Ethnicity of Voter

White

Black

Latino

Asian

Donald Trump

61

9

47

n/a

Joe Biden

38

89

52

n/a

Source:  CNN Exit Polls, n = 5,906 ( n/a = sample to small to project)


Table 5: Exit Poll Outcomes for Arizona Presidential Candidates, 2020

Candidate

Race-Ethnicity of Voter

White

Black

Latino

Asian

Donald Trump

51

n/a

36

n/a

Joe Biden

47

n/a

63

n/a

Source:  CNN Exit Polls, n = 1,639 (n/a = sample too small to project)


To obtain a more detailed picture of candidate support at the county level for South Texas, Table 6 below presents the eight “heavily Hispanic” counties in South Texas that were included in the recent analysis by the Dallas Morning News [18] and used as the basis for sounding the alarm bell to Texas Democrats. Frio County was included in their analysis although it is part of West Texas.  The table reveals that support for Donald Trump ranged from 50 to 66 percent; the region produced a total of 8,975 college graduates who were 25 years or older; and there were high concentrations of Hispanics that ranged from 73 to 94 percent (median of 83%). The region showed only 103,833 registered voters.


Table 6: Heavily South Texas Hispanic Counties Carried by Trump

County

Total Registered Voters

No. Hispanic College Graduates 25yrs & Over

Percent Voted for Trump

Percent Voted for Biden

Pct. Hispanic Pop. 2018

Frio (West Tx)

8,984

500

53.7

46.3

78.8

Jim Wells

26,636

1,784

54.8

45.2

80.3

Kenedy

296

12

66.1

33.9

87.7

Kleberg

18,749

2,254

50.9

49.1

72.7

LaSalle

4,426

345

55.9

44.1

82.4

Reeves

7,558

431

61.7

38.3

75.1

Val Verde

28,927

3,021

55.0

45.0

81.8

Zapata

8,257

628

52.8

47.2

94.2

Total 8 Counties

103,833

8,975

54.4

45.6

83.0

           Source: https://results.texas-election.com/county / ACS 2018 5-Year Estimates. 

Previous polling of U.S. Latinos by the Pew Research Center revealed that Joe Biden’s support was distinctly higher for college graduates (69%) than non-college graduates (61%).[19]   The percentage of college graduates in the South Texas region was 17.8 percent, which was distinctly lower than the State of Texas (29.3%) and the U.S. (31.5%). [20] The South Texas region produces its share of college graduates, but many move away due to a poor economy, leaving only 8,975 graduates who resided in the region in 2018. The political potential of South Texas is limited by the small number of registered voters and college graduates.

In our opinion, the high percentage of Hispanics in the South Texas region (83.0%) is perhaps the key factor that attracts the attention of political candidates, journalists and pundits who tend to portray South Texas as the bell weather region for Texas Latino politics.  However, the focus on percentages can be misleading as an indicator of political influence when the population base and number of registered voters is small in comparison to other regions in Texas.   

Considerably greater political benefit was realized by the Biden campaign in larger urban areas in Texas with higher numbers of Hispanic registered voters and college graduates. Table 7 below page presents a similar profile for the top five Texas counties ranked by the total number of registered voters. It is readily apparent that these five counties included a much larger number of registered voters (7.1 million) and more Hispanic college graduates (449,751) despite having a more moderate concentration of the Hispanic population ranging from 29 to 60 percent (median = 41%). More importantly, support for Joe Biden was distinctly higher than the South Texas region, ranging from 50 to 73 percent. Interestingly, Travis County had one of the lowest percentages of the Hispanic population (33.9%), yet also revealed the highest level of support for Joe Biden (73.0%) – an affirmation of the political power leveraged by the college-educated community surrounding The University of Texas at Austin. Thus, a moderate concentration of Hispanics coupled with a substantial college-educated community appears to have substantially contributed to Joe Biden’s standing in Texas.

Table 7: Voter Profile of Top 5 Texas Counties Ranked by Number of Registered Voters

Top 5 Counties

Total Registered Voters

No. Hispanic College Graduates 25yrs & Over

Pct. of All Votes for Trump

Pct. of All Votes for Biden

Pct. Hispanic Pop. 2018

Harris

2,480,522

140,157

43.4

56.6

42.6

Dallas

1,398,469

54,553

33.9

66.1

39.9

Tarrant

1,212,524

68,466

50.0

50.0

28.5

Bexar

1,189,373

118,109

40.8

59.2

60.0

Travis

854,577

68,466

27.0

73.0

33.9

Total 5 Counties

7,135,465

449,751

40.2

59.8

41.0


The political muscle of communities with colleges and universities has been documented by other analysts as well. In past presidential elections, counties with flagship higher education institutions have increasingly swung toward Democrats.  According to a recent analysis of 2020 election results by The Chronicle of Higher Education, Trump carried 87 of the 136 counties in five states that flipped from Trump in 2016 to Biden in 2020 (Arizona, Georgia, Michigan, Pennsylvania and Wisconsin) that included four-year public or private nonprofit colleges with at least 100 students.  Biden carried only 49 of these counties according to unofficial results. How did Biden manage to flip these five states?  As explained by the reporter analyzing this outcome:

“But Biden’s counties were more populous:  They produced 12.7 million total votes, more than double the 5.4 million votes that came from the counties with colleges in them that Trump won.  Biden’s counties, while smaller in number, also had more colleges in them:  191 to 138 in Trump’s counties.”  (page 2) [21]


Thus, Trump’s advantage of capturing more counties was overcome by Biden’s advantage of capturing fewer counties with substantially more voters.


Did Weak Support in South Texas Cause Joe Biden to Lose Texas?

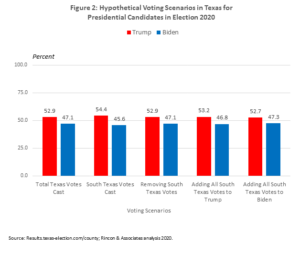
Some of the news stories suggested that Joe Biden had lost the Texas vote to Trump due to weak Latino support in South Texas compared to the support previously enjoyed by Hillary Clinton in 2016.  To address this issue, we conducted three hypothetical analyses to evaluate how the statewide voting outcomes for Donald Trump and Joe Biden would change under the following three scenarios:

·       Scenario 1: All of the votes cast by South Texas were removed from the total votes cast in Texas

·       Scenario 2: All of the South Texas votes were cast in favor of Donald Trump

·       Scenario 3: All of the South Texas votes were cast in favor of Joe Biden

Table 8 below presents the calculations used to evaluate these three scenarios.

Table 8: Hypothetical Voting Scenarios for Presidential Vote in Texas

Scenario

Trump

Biden

Total

Total Texas Votes Cast

5,860,096

5,211,406

11,071,502

Percent

52.9

47.1

100.0

South Texas Votes Cast

29,270

24,537

53,807

Percent

54.4

45.6

100.0

Scenario 1: Removing South Texas Votes

5,830,826

5,186,869

11,017,695

Adjusted Percent

52.9

47.1

100.0

Scenario 2: Adding All South Texas Votes to Trump

5,884,633

5,186,869

11,071,502

Adjusted Percent

53.2

46.8

100.0

Scenario 3: Adding All South Texas Votes to Biden

5,870,826

5,240,676

11,071,502

Adjusted Percent

52.7

47.3

100.0

Source: Results.texas-election.com/county; Rincon & Associates Analysis, 2020

Using the percentages for each scenario in Table 8, Figure 2 below clearly illustrates that under each scenario, Donald Trump still wins the Texas vote.  Thus, the votes from South Texas – regardless of whether they were totally removed or changed to votes for Trump or Biden – would not have changed the final Texas vote outcome for the presidential candidates.

How much confidence can we place on Hispanic polling results?

As final food for thought, it is helpful to weigh in the insights from The New York Times polling expert – Nate Cohn – who recently shared his post-mortem of the 2020 election in an op-ed entitled “What went wrong with polling?  Some early theories.”  Of particular relevance are his conclusions about the extent to which 2020 polling errors were influenced by Hispanic voters. The following comments are paraphrased from his narrative:

“What appeared in Miami-Dade was not just about Cuban-Americans.  Although Democrats flipped a Senate seat and are leading the presidential race in Arizona, Mr. Trump made huge gains in many Hispanic communities across the country…Many national surveys don’t release results for Hispanic voters because any given survey usually has only a small sample of this group….But if the Florida polls are any indication, it’s at least possible that national surveys missed Mr. Trump’s strength among Hispanic voters.  It seems entirely possible that the polls could have missed by 10 points among the group. If true, it would account for a modest but significant part – maybe one-fourth – of the national polling error.”  (p. 6) [22]


Mr. Cohn’s assessment may have merit regarding pollsters who only occasionally conduct polls of U.S. Hispanics and thus more likely to include common sources of bias in studies of this population segment. However, the results of polls of U.S. Hispanics conducted by more experienced pollsters of Hispanics – such as Latino Decisions and Pew Research Center — often include larger samples and were more closely aligned with the results of exit polls conducted by CNN — resulting perhaps in less polling error.  In our recent publication, “The Culture of Research,” [23]  we discuss the following common sources of bias that are observed in surveys of multicultural populations:


·       Identity Bias:  The use of vague, outdated or offensive race-ethnic labels that lead to over-counts or under-counts of respondents, or just missing data.

·       Coverage Bias: The use of sampling frames that exclude Hispanics, immigrants, the lower income and non-English speakers.

·       Sampling Bias:  Selecting samples of respondents that do not represent the population of interest, often by using non-random samples, small samples or sampling high density areas populated by Blacks, Hispanics or Asians. 

·       Mode Bias: Providing survey respondents only one mode (i.e., telephone, online or mail) to complete a survey which can exclude persons with vision, hearing or speaking impairments, lower literacy skills, or no Internet access.

·       Language Bias: Providing English-only surveys or poorly translated surveys to Hispanic and Asian immigrants lowers response rates and response quality since immigrants prefer native language surveys that are accurately translated.

·       Weighting Bias: Distorted statistical indicators can result from the failure to apply weights to correct survey sample imbalances or using weights that are outdated.


We agree with Mr. Cohen that greater polling error can occur in studies that include Hispanic populations, although we would add that such errors are more likely to occur in polls conducted by companies that do not have a strong track record for conducting studies of U.S. Hispanics.


Conclusion

Although the final 2020 election results with detailed demographic information will not be available for several months, there are some general conclusions that we can make given the information reviewed thus far:


·       Joe Biden did not lose Texas due to weak support from South Texas Latinos but rather the limited political resources in the region.

·       Latino voters were highly engaged to vote in the 2020 election as determined by pre-election polls.[24]

·       Despite the threat of COVID-19 and numerous voter suppression tactics by the Republican Party, Latinos turned out to vote in historic numbers.

·       Latinos were responsive to the message strategies of both campaigns, whether the message was accurate or fabricated. Latino Trumpers in Florida and Texas appeared more trusting and easier to mislead with false information.

·       Latinos revealed stronger support for Joe Biden than Donald Trump in Texas, Florida and Arizona, although stronger than expected Latino support was observed for Donald Trump.

·       Joe Biden revealed stronger support among Hispanic women, the college-educated, and those living in large urban areas.  Donald Trump showed stronger support from Hispanic males who were not college educated and lived in smaller urban and rural communities.

·       There is reason to believe that national pollsters experienced more errors when measuring the sentiments of Hispanic voters, although more confidence was proposed for pollsters with a stronger track record in polling the Hispanic population and using higher standards.


End Notes


[1] CNN Exit Polls (2020, November 11). Accessed at: https://www.cnn.com/election/2020/exit-polls/president/national-results/0

[3] Garrett, R.T. and Hacker, H.K. (2020, November 4). Dark alley no more:  This time, Texas Republicans were ready for the Democrats. Dallas Morning News. Accessed at  https://www.dallasnews.com/news/elections/2020/11/04/dark-alley-no-more-this-time-texas-republicans-were-ready-for-the-democrats/

[4] Ibid.

[5]  Medina, J.  (2020, October 19). The macho appeal of Donald Trump. New York Times. Accessed at https://www.nytimes.com/2020/10/14/us/politics/trump-macho-appeal.html

[6] Chavez, N. (2020, November 9).  ‘There’s no such thing as the Latino vote.’ 2020 results reveal a complex electorate.  CNN, Accessed at: https://www.cnn.com/2020/11/09/politics/latino-voters-florida-texas-arizona/index.html

[7] Ibid, 2.  Solis, D., Corchado, A., Morris, A., and Cobler, P. (2020, November 6). With the Latino vote up for grabs, how did Trump make inroads in South Texas? 

[8] Comptroller.Texas.Gov. (2020, November 6). The South Texas Region 2020 Regional Report. Texas State Comptroller, Accessed at:   https://comptroller.texas.gov/economy/economic-data/regions/south.php

[10]  Jatlaoui, T.C. Eckhaus, L., and Mandel, M.G.  (2019, November 29). Abortion Surveillance – United States 2016. MMWR Surveill Summ 2018; 68 (No. SS-11: 1-41. Accessed at: https://www.cdc.gov/mmwr/volumes/68/ss/ss6811a1.htm

[11] Korzenny and Korzenny, (   ).  Hispanic marketing.

[12]  Hancı, F. (2019, July 22).  Hate crimes increase in the US since Trump’s election. Politics Today, Accessed at        https://politicstoday.org/hate-crimes-increase-in-the-us-since-trumps-election/

[13] Brooks, B. (2019, November 12).  Victims of anti-Latino hate crimes soar in U.S.: FBI report.   Reuters. Accessed at https://www.reuters.com/article/us-hatecrimes-report/victims-of-anti-latino-hate-crimes-soar-in-u-s-fbi-report-idUSKBN1XM2OQ

[14]  Anderson, K.B. (2013, April). Consumer Fraud in the United States, 2011 The Third FTC Survey, Federal Trade Commission, Accessed at:   https://www.ftc.gov/sites/default/files/documents/reports/consumer-fraud-united-states-2011-third-ftc-survey/130419fraudsurvey_0.pdf

[15] Ibid 8, The South Texas Region 2020 Regional Report.

[16] Ibid 1, CNN Exit polls in Texas.

[17] Barreto, M. (2016, November 10). Lies, damn lies and exit polls. Latino Decisions. Retrieved from http://www.latinodecisions.com/blog/2016/11/10/lies-damn-lies-and-exit-polls/

[18] Ibid 3, Dark alley no more:  This time, Texas Republicans were ready for the Democrats.

[19] Krogstad, J.M. and Lopez, M.H. (2020, October 16).  Latino voters have growing confidence on Biden key issues, while confidence in Trump remains low. Pew Research Center, Accessed at:   https://www.pewresearch.org/fact-tank/2020/10/16/latino-voters-have-growing-confidence-in-biden-on-key-issues-while-confidence-in-trump-remains-low/

[20] Ibid 8, The South Texas Region 2020 Regional Report.

[21] June, A.W. (2020, November 15).  How higher ed helped flip 5 states in the 2020 election. The Chronicle of Higher Education.  Accessed at https://www.chronicle.com/article/how-higher-ed-helped-flip-5-states-in-the-2020-election

[22] Cohn, N.  (2020, November 10).  What went wrong with polling?  Some early theories.  The New York Times – Upshot. Accessed at https://www.nytimes.com/2020/11/10/upshot/polls-what-went-wrong.html 

[23] Rincon, E.T.  (2020, August 20).  The Culture of Research.  The Writer’s Marq, Dallas, Texas.

The Richards Group Steps into a Multicultural Minefield

The recent headlines about Stan Richards’ controversial comments regarding their Motel 6 client sounded an alarm bell throughout the advertising and marketing industry, especially as it relates to multicultural marketing.  As the recent Dallas Morning News story reports, Mr. Richards stated in a meeting at the ad agency’s office that a particular ad pitch for Motel 6 was “too Black”  for its “white supremacist constituents.”  The statements were reportedly made during an internal meeting to discuss an idea for celebrating Black artists in a Motel 6 campaign.

The ensuing reaction by the firm’s clients was a bloodbath:  In addition to losing the Motel 6 account, The Richard Group also lost accounts for Home Depot, Keurig/Dr. Pepper/Keurig, H-E-B, Orkin and Advanced Auto Parts.  Last year, The Richards Group reported revenues of $200 million, but the loss of these large accounts will lead to the loss of many jobs at the firm.

Mr. Richards has apologized for his misstatements and assured us that he has never uttered racists comments in the past. He “fired” himself from the firm while operations will be assumed by his hand-picked successor, Glen Dady, who has worked with Richards for 40 years. In addition, Richards is planning to create a new position on diversity, equity and inclusion; begin bias training for staff; and commit to becoming more “culturally relevant.”

 In the past, such apologies may have been forgiven in due time but the current volatile climate for race relations in the U.S. suggests that The Richards Group will feel the pain for a longer period of time. With such a close relationship to his successor, one wonders if changes will indeed occur or whether traditional practices will continue.

As a research professional who has evaluated multicultural campaigns for the past 45 years, it is indeed difficult to understand why Mr. Richards felt the need to make the controversial statements about the multicultural campaign.  In the normal course of campaigns, it is customary to conduct focus group research with members of the target audiences and let them judge the appropriateness of the advertising concept for themselves or members of their communities.  Why would Mr. Richards feel like his views should override the views of the Black or white customers for Motel 6?  And why telegraph the message that Blacks are not welcomed at Motel 6 or that its preferred customers are “white supremacists?”  While Mr. Richards is described as being “fiercely independent,” it appears consultation with a multicultural expert may have been the best approach.

This unfortunate incident underscores a general problem that permeates academic institutions today, that is, the relative absence of courses in multicultural marketing, public relations and research. The multicultural segment in the U.S. numbering 120 million in 2019, has brought considerable cultural and linguistic diversity to this nation, and continues to challenge the work of advertising agencies and research practitioners.  Unfortunately, these industries have not kept pace with the changing composition of the U.S. population, and college graduates are not receiving sufficient training regarding the best communicative strategies for this growing segment.  Instead, academics have chosen to focus their curricula on international markets rather than the more relevant issues related to U.S. multicultural consumers – a pattern that needs to change.

Certainly, it is never too late to make a company more culturally relevant, especially if your client base serves a large segment of multicultural consumers.  Like the recent experience of racially profiling Black customers by Starbucks, The Richards Group reputation may benefit from staff bias training to staff and hiring someone to lead a newly created diversity, equity and inclusion department. In my opinion, however, this transformation will require more substantive changes in order to be successful. My suggested changes include the following:

·       Hiring multicultural staff – Blacks, Hispanics and Asians – to become key members of the advertising staff.  Aside from ethnicity, these individuals should be experienced professionals that understand these communities.

·       Ensure that the Board of Directors includes multicultural members who are seasoned professionals with intimate knowledge of multicultural communities.

·       Persuade academic institutions to include courses on multicultural marketing, public relations, and research in marketing and advertising departments – thus ensuring that future generations of college graduates will have the foundation to make better judgments regarding multicultural consumers.


It will take time for The Richards Group to recover from this unfortunate incident, and the firm is paying dearly for its misstep.  On the bright side, however,  this experience provides a strong message to the broader advertising and marketing communities that their activities as well as their clientele will be closely watched in the current climate of fragile race relations.

Journalistic Practices Are Muting the Voices in Communities of Color


It is no secret that the world of journalism has experienced considerable difficulty in recent years with declining audiences. Web-based news networks are major competitors for news audiences, while bloggers have expanded during this time to fill the void by traditional news sources.  In the meantime, a dramatic demographic shift has taken place in the U.S. over the past decade that has added millions of Hispanics, Blacks and Asians – currently numbering 119,505,700 [i] — that are potential audiences with interest in general and culturally relevant news.

Over the past 45 years, I have conducted numerous research studies of multicultural communities throughout the U.S., many which involved their media and consumer behavior, and have also taught survey research methods at several North Texas universities. This experience, coupled with changes in the media landscape and demographic composition of the U.S. population, points to a disturbing pattern that I have observed in news coverage that is muting the voices in communities of color and limiting news stories to a set of predictable topics. As a case in point, I will describe these patterns for the Dallas Morning News, a mainstream newspaper in North Texas, which I have studied in more depth in past years and read on a regular basis. These patterns, however, may describe other media in large urban markets like the City of Dallas.  Although not an exhaustive list, following are some of the disturbing patterns that I observed:

·       A lack of interest in investigating potential bidding and contract irregularities associated with the 2020 Census campaign for Dallas County. According to recent news coverage by Dallas Morning News, concern was raised regarding vendor performance since Census response rates for Dallas County were clearly lagging behind other Texas counties with large populations.

·       A lack of interest in addressing a legacy of supermarket redlining practices that limit the healthy food choices in Black and Hispanic food deserts, especially relevant in the pandemic environment.

·       The practice of excluding Black and Hispanic faculty or experts in news stories that tap their expertise. While not the “usual suspects,” these individuals are present in North Texas and not difficult to identify.

·       A pattern of exclusion of local Hispanic op-ed contributors to the Viewpoints section.  Several years ago, Carolyn Barta – a past Viewpoints Editor at DMN — invited a group of known Hispanic writers (including myself) to submit op-ed pieces to Viewpoints, but acceptance of these submissions dwindled after Ms. Barta’s departure which muted the voices of these Hispanic writers.

·       Coverage of positive stories during Hispanic Heritage Month and Black History Month have been a common practice, but coverage over the remaining 11 months has generally focused on poverty, immigration, under-achievement, crime patterns, and similar downbeat topics.

·       Careless reporting of crime patterns has sometimes mis-portrayed communities of color as hot crime spots, which discourages economic development in these areas.

·       Rather than focus on economic activity and achievements, business news about the Dallas Hispanic Chamber has generally focused on internal problems that they were experiencing.

·       Books written by Hispanic authors with a scientific or social science focus often escape the attention of journalists — with the possible exception of cookbooks. 

·       In response to the growing presence of Latinos, many mainstream media shops have added Spanish-language publications that are primarily read by Latino immigrants. Unfortunately, Hispanic-focused stories that are placed only in Spanish-language publications become segregated from English-language audiences – reinforcing the continuing segregation that is already evident in housing, education, religious and social areas.

·       Media companies with Spanish-language assets may face tougher times into the future [ii] as the potential audience for Spanish-language media continues to decline.  Indeed, the Census Bureau experts project that, by the year 2060, 46 million native-born Latinos will be added to the U.S.— vastly out-numbering the 7.6 million foreign born Latinos.


Going forward, my hope is that journalists and schools of journalism will reflect on these patterns and consider the extent to which they describe their respective practices.  Unless these journalistic patterns change, mainstream media like the Dallas Morning News may become obsolete as a consequence of their reluctance to connect with the changing composition and interests of their audiences. Spanish-language media, on the other hand, may need to re-evaluate their growth strategy into the future.

The Dallas Morning News, and the other major newspapers and media outlets here in North Texas and around the country need to take bold, proactive steps to better reflect and cover communities of color, and clearly needs to intensify its efforts to at least make sure we have a share of the voice as sources and in opinion columns.


End Notes


[i]Census Bureau (2020). American Community Survey 2019 One-Year Estimates, accessed at www.data.census.gov.

[ii]Rincon, E. T. (2020, April 01). A perfect storm is facing U.S. supermarkets.  Journal of Marketing Channels.  

Why are Republicans Scrambling to Suppress the Latino Vote?

It is indeed puzzling to witness Republicans scrambling to suppress the Latino vote for the November election.  Governor Gregg Abbott recently ordered a limit of only one mail-in ballot drop-off location for each Texas county, an action that has initiated lawsuits charging Latino voter suppression from the League of United Latin American Citizens (LULAC), the Texas chapter of the League of Women Voters, and two individuals.

In addition to creating more difficulty for Latino voters, Governor Abbott’s action creates higher barriers for persons with disabilities and those 65 years and older who are concerned for their personal safety and the additional distance that they will need to travel to a single location.  

Other recent actions initiated by Republicans to limit voter participation include the numerous false allegations of fraud associated with mail-in ballots, significant reductions in the capabilities of the U.S. Post Office to process mail-in ballots, and not allowing Texas voters to use COVID-19 exposure as a basis for requesting a mail-in ballot.

The irony is not lost here – why are Republicans in such a frenzy to further limit Latino voter participation given their historically low voter turnout rates in past presidential elections? According to Pew Research, Latino voter turnout rates were 48.0 percent in 2012; 27.0 percent in 2014; 47.6 percent in 2016; and 40.4 percent in 2018. No cause for worry, right?

Rather than encourage Latino voter turnout, however, Republicans like Gov. Abbott are experiencing a re-awakening of their strategy due to several recent trends:

·       Highly populated areas like Harris County expect a surge of mail-in ballots, especially from Democratic precincts that include many Latinos and Blacks;

·        The number of mail-in ballots that have been requested from Democratic-leaning precincts are dramatically out-numbering the Republican precincts;

·        Most recent polls confirm that two-thirds of Latino registered voters would support Biden while Trump captures only one-third of the vote, a trend that is consistent across the battleground states;

·        Bloomberg is investing millions to support Democratic candidates;

·        According to Pew Research, 32 million Latinos are projected to be eligible to vote this November and represent 13.3 percent of all eligible voters in the U.S.


Governor Abbott’s action especially wreaks of hypocrisy. During the last gubernatorial election, the governor’s televised campaign included a Hispanic family member in a pitch to capture the support of Texas Latinos. While the Latino vote may have been candy to Governor Abbott in the past, perhaps the governor’s current sentiments about Latino voters is best captured in B.B. King’s song “The Thrill is Gone.”

With the exception of LULAC, it is particularly troublesome to observe the relative silence among Latino business and civic organizations that have publicly challenged the legality and morality of these Latino voter suppression tactics.  Rather than bury one’s head in the sand, these voices need to be loud and constant in the days remaining to the November election.

In my opinion, the available evidence regarding the increasing number of Latino eligible voters, registration rates, and polling results suggests that Latinos are energized to vote in the November election and that Republicans may pay a heavy price for their deliberate tactics to suppress the Latino vote.

Polls Provide Conflicting Views of Hispanic Support for Biden vs. Trump


As the presidential campaign gains momentum, the Hispanic vote has become the subject of focused attention by pollsters who are reporting substantially different levels of support for candidates Trump and Biden. 

A recent poll sponsored by the Texas Hispanic Policy Foundation reported a rather surprising result: 47% preferred Biden while 38% preferred Trump – a 9 percent difference.  Based on this outcome as well as comparison’s to Hillary Clinton’s Latino support in 2016, various news sources are portraying Biden as losing ground with the Hispanic electorate or running a campaign that is out of touch with the needs of this important voter segment.  The online poll was conducted by YouGov using their proprietary methodology that has been widely used in past years but not necessarily in Hispanic-targeted polling.

The results from the Texas Hispanic Policy Foundation poll are especially surprising because they contradicted the findings of various recent polls that included sub-samples of Latino voters that generally found that Biden has enjoyed a double-digit lead over Trump. [1] 

Recent Polls Including Latino Sub-Samples

                   (Percent)

Source

Date

Biden

Trump

Difference

Quinnipac

7/22/2020

53

29

24

CBS/YouGov

7/12/2020

60

30

30

UT/Trib

7/3/2020

46

39

7

Fox News

6/25/2020

62

25

37

PPP/Progress Texas

6/23/2020

64

27

37

PPP/TDP

6/5/2020

66

23

43

Quinnipac

6/2/2020

53

32

21

Source:  Off the Kuff, 2020

 Curiously, this summary of recent polls by Kuff [2] omitted two other key polls conducted by survey organizations that have historically used the highest methodological standards when conducting polls of U.S. Latinos.[3]  For example, recent polling by Latino Decisions in six battleground states – including Arizona, Florida, Texas, North Carolina and Pennsylvania — confirmed a similar double-digit Biden advantage over Trump [4] while a recent poll of U.S. Latinos by Pew Research Center [5] also confirmed Biden’s double-digit lead over Trump. 

Lastly, an ABC/Washington Post poll released on Sept. 23, 2020 of likely voters shows that, among Latinos, Biden maintains a double-digit lead over Trump (61% vs. 34%) and a smaller double-digit lead in Florida (52% vs. 39%). [6]

Who is correct?  The answer to this question has important implications for the political messaging that is conveyed about Hispanic voters between now and election day since it could influence voter turnout. Is Biden really losing ground among Latino voters, or should we consider the poll sponsored by the Texas Hispanic Policy Foundation an anomaly?

Over the past 45 years, I have taught survey research methods at four North Texas universities and developed an interest in conducting post-mortems on the methodology employed in studies of multicultural persons whose results were conflicting or controversial. Over the years, this interest has included challenges to the Nielsen Hispanic television ratings, measurement bias in college admissions tests, biased surveys in municipal elections, estimates of COVID-19 mortality rates for Blacks and Hispanics, biased crime reporting in urban areas, and site location methods that reinforce redlining practices in communities of color.  The goal of these post-mortems is to help the general public understand which one of these conflicting or controversial studies is more deserving of our confidence using criteria that I have discussed elsewhere in some detail. [7]In my opinion, I would place my confidence on the pollsters with a proven track record in measuring Latino sentiments.  Let me explain my reasoning.

While I did not have sufficient information to conduct a detailed post-mortem on the methodology utilized by YouGov in the Texas Hispanic Policy Foundation study of Texas Latinos, there were some concerns that were noted by Huff in his recent summary of Latino polls. [8] For example, the report did not identify the Hispanic sample size and its margin of error, while the survey results may have been distorted due to the use of outdated 2016 data to weight the survey results. Huff also expressed concern about the obvious discrepancy between the YouGov poll results and the results from the various polls including Latino voters. While it has merit, it is my opinion that the methodology used by YouGov lacks the historical track record in measuring Hispanic voter sentiments that has been employed for decades by Latino Decisions and Pew Research Center.

Perhaps the more compelling reason that raises skepticism is the inference by political pundits that Hispanic voter support for Trump is on the rise, a rather untenable position given his repeated attacks and hate-filled speeches directed at U.S. Hispanics.  Indeed, are we to believe that Hispanics suddenly feel compelled to reward Trump with their votes despite these attacks?  I don’t think so. Hispanic families have suffered significantly under Trump’s presidency and are not likely to forget these attacks as they decide to cast their vote this November.

Jason Villalba, President of the Texas Hispanic Policy Foundation, concluded from his organization’s polling results that “neither presidential candidate has yet to completely lock down the Texas Hispanic vote.” [9]  Based on the concerns raised about YouGov’s polling methodology, I would say that his conclusion is pre-mature and lacks confirmation by other trusted sources. Moreover, the report appears dismissive of the substantial Latino support shown for Biden in the various other polls conducted recently and makes little effort to reconcile the contradictory findings. The Biden campaign has accumulated millions in their campaign fund which may be utilized to solidify his standing among Hispanic voters, especially in the battleground states. Indeed, there is room for optimism.

Going forward, I believe that we would be wise to place our confidence on the polling results provided by the more trusted sources in Latino polling with a proven track record such as Pew Research Center or Latino Decisions. 

 End Notes


[1] Kuffner, C. (2020, August). What is the level of Latino support for Trump in Texas?  Off the Kuff. Accessed at http://www.offthekuff.com/wp/?p=96928

[2] Ibid, Kuffner, C.

[3] Rincon, E.T. (2020, August).  The Culture of Research.  The Writer’s Marq LLC.

[4]  Latino Decisions (July 2020).  Latino Voter Engagement and Mobilization in Six States,  Accessed at: https://latinodecisions.com/polls-and-research/latino-voter-engagement-and-mobilization-in-six-states/

[6] Langer, G. (2020, Sept. 23).  Trust on the economy bolsters Trump in oh-so-close Florida and Arizona: POLL. ABC News, Accessed at: https://abcnews.go.com/Politics/trust-economy-bolsters-trump-close-florida-arizona-poll/story?id=73167150

[7] Ibid, Rincon, E.T.

[8] Ibid, Kuffner, C.

[9] Texas Hispanic Policy Foundation (2020, August 17). Texas Hispanics Prefer Biden: Trump Leads Overall in State. THPC website, Accessed at https://www.txhpf.org/2020/08/17/texas-hispanics-prefer-biden-trump-leads-overall-in-state/

President Trump Launches a Civil War Against the American Public

As the November presidential election nears, there are noticeable palpitations from the Trump campaign and his supporters, which has prompted an undeclared civil war against the American public. Fueling the anxiety level throughout the Republican party is Trump’s epic failure in acknowledging and managing the Covid-19 pandemic as well as the double-digit lead by Joe Biden in several national polls. To breathe new life to his failing campaign strategy, Trump has chosen to heighten the misery index across the country with a series of actions designed to weaken the democratic electorate and keep his job for another term.   Following is a sampling of the extreme and somewhat bizarre actions that the Trump administration has directed at the American public:
Voting and Apportionment 
·       Aggressive efforts to eliminate the use of mail-in ballots despite little evidence of voter fraud and the potential exposure of voters to Covid-19 infections.  According to recent research by the Pew Research Center,  “About two-thirds of Americans say the option to vote early or absentee should be available to any voter without requiring a documented reason, while a third say early and absentee voting should only be allowed with a reason. Democrats overwhelmingly back “no excuse” early or absentee voting: 83% support it. By comparison, 55% of Republicans say a documented reason should be necessary to vote early or absentee.” [1]  
·       Attempts to include a citizenship question in the Census 2020 questionnaire designed to discourage immigrant participation in the census – later rejected by the U.S. Supreme Court.
·       Recently signing an executive order to remove counts of unauthorized immigrants from the Census computations used to define legislative districts – an action that will be legally challenged by several civil rights organizations. According to recent analysis of government data by Pew Research, the removal of these immigrants would mean that three states each could lose a U.S. House seat, while three others each could gain one.
Covid-19
·       Stating the “testing was over-rated,” Trump has delayed increasing the level of funding for Covid-19 testing and tracking despite the growing surge in infections and mortalities throughout the country.
·       A refusal to issue a federal mandate to expand the availability of personal protective equipment (PPE).
·       Trump actually recommended the use of a disinfectant like Lysol to treat Covid-19 patients.
·       Requiring hospitals to re-direct records related for Covid-19 hospitalizations from the CDC to the Department of Health and Human Services – considered by the nation’s healthcare professionals as a political attempt to obscure the true picture of Covid-19 infections and mortalities. Further evidence that the Trump administration is politicizing the data collection and analysis the pandemic data is the recent announcement by the CDC that race and ethnic minorities are no longer considered high risk or meriting higher priority for certain health services [2]. Why?  Because their Covid-19 high hospitalization, infection and mortality rates result from social determinants, not genetics, and there is a need to avoid stigmatizing and victimizing these groups.  While social determinants are indeed important factors that contribute to the higher prevalence of Covid-19 in Black and Hispanic communities, it makes little sense to use this as a basis for removing their high risk designation — indeed, they are still at high risk regardless of the circumstances that placed them at high risk.
·       The continued failure to order a national mandate for wearing face masks despite the advice of global medical experts.
·       The failure to clear up the large amount of missing race-ethnic data related to Covid-19 mortalities which greatly underestimates the mortality rates for communities of color. According to Janet Hamilton, executive director of Council of State and Territorial Epidemiologists, race and ethnicity data is missing 80% to 85% of the time, while patient address and telephone numbers are missing as much as 50% of the time.  A standard form to record such information if often not used by physicians since it is not considered a priority. [2]
·       The failure to increase OSHA inspections of employers to check compliance with CDC recommended practices related to Covid-19 employment policies. Clusters of Covid-19 infections have grown rapidly in factories and food suppliers where employees are forced to work in close proximity without the proper protective equipment.
Education
·       Pressuring schools to allow in-person instruction despite the high Covid-19 infection rates in their communities and the increased potential of exposure to students and teachers.
·       Issuing an executive order requiring foreign students in U.S. academic institutions to attend in-person classes despite Covid-19 risk — later rescinded due to many protests from U.S. academic institutions and private high-tech employers.
Abusive Actions
·       Using tear gas and injuring residents engaged in peaceful protests, as recently occurred at protests at the White House and Portland, Oregon.
·       Threatening to send Federal agents to quell peaceful protests regarding Black Lives Matter, especially in “Democratic” cities like Chicago and Albuquerque.
·       Supporting the presence of the Confederate flag, statues and similar symbolism in public places that are racially divisive.
Immigration
·       Misportraying immigrants as criminals despite substantial evidence that their crime rates are lower than native-born residents in the U.S.
·       Failure to process new DACA (i.e., Dreamer) applications despite a recent ruling by the U.S. Supreme Court to allows this process.
Coupled with the support of the Republican party, Trump’s civil war against the American public will likely diminish voter participation among Democrats during the upcoming November election, expand the spread of Covid-19 infections and mortalities, and generally deteriorate the quality of life for all U.S. residents. This level of aggression towards the American public is perplexing, especially given that our political leaders are sworn to protect U.S. residents, not harm them. 
This is not the first time, however, that Trump’s patriotism for his countrymen has been the subject of some controversy. For example, Trump has consistently praised world dictators that are known to oppress the human rights of their constituents and disparaged recognized war heroes like the late Sen. John McCain.  According to a news report, Trump avoided military service during the Vietnam conflict due to a bone spur, which earned him the title “Cadet Bone Spurs” – a term attributed by Senator Tammy Duckworth, a Purpose Heart recipient.  A story in the New York Times [3]reported that a foot doctor in Queens who rented his office from Mr. Trump’s father, Fred C. Trump, suggested that the diagnosis was granted as a courtesy to the elder Mr. Trump. In addition to avoiding military service, Mr. Trump continues to show his support for racially divisive Confederate flags and statues.
By accelerating their civil war, Cadet Bone Spurs and his Republican comrades are apparently prepared to win the November election at any cost to the health, safety and civil rights of the American public. For the upcoming November election, voters should seriously question whether Donald Trump and his fellow Republicans deserve to  represent a country whose values and quality of life they have chosen to abandon.  
References

Governor Greg Abbott Fumbles the Ball on Covid-19

As the leading quarterback in Texas, Gov. Abbott has shown a repeated tendency to fumble the ball as Covid-19 infections have surged in Texas. Instead of following the advice of the nation’s top experts on controlling the spread of Covid-19, Gov. Abbott has opted instead to place the lives of many Texans at risk by following the GOP party line of opening the Texas economy.  The governor was warned repeatedly by the commissioners in Dallas and Harris counties that Texas was not ready to re-open its businesses, but their advice was ignored and sometimes ridiculed by Abbott.  The consequences of this oversight have been devastating. Not surprisingly, the Texas Democratic Party described the governor’s strategy as “reckless.” [1]

After the governor authorized the re-opening of Texas businesses, Travis, Harris and Dallas counties experienced record high cases for two weeks, surging to 4,739 on Thursday morning (June 25th) and tripling since Memorial Day.[2] These three counties are now reviving plans for temporary hospital facilities to prepare for overwhelmed hospitals.  Gov. Abbott finally acknowledged that the opening of businesses was perhaps a bit premature and should be “paused” to ease the burden on Texas hospitals.  As a result, he issued an executive order to close all bars in Texas and reduce the restaurant capacity to 50 percent.   Unfortunately, a definitive action to mandate the use of face masks in public – considered highly effective in slowing the spread of Covid-19 — did not emerge.

As the governor recently explained: “The last thing we want to do is go backwards and close down businesses…the pause will help our state corral the spread.”  Indeed, the Covid-19 spread does not pause simply by closing business establishments but will continue to seek other victims, especially those that are unprotected by face masks, meeting or working indoors in groups, and persons with existing comorbidities. 

The Covid-19 statistics in Texas are quite grim:  137,624 reported cases; 2,324 fatalities, and 59,018 active cases.[3]  How many more lives need to be sacrificed before Governor Abbott decides to more aggressively slow the spread of Covid-19?  Interestingly, while Governor Abbott continues to fumble with his hit-or-miss strategy, other states like New York, New Jersey and Connecticut that have more successfully controlled the spread of Covid-19 are requiring a 14-day quarantine for visitors from states like Texas with big outbreaks of the virus. [4]

Impact on Communities of Color in Texas
The consequences of these poor judgements by Governor Abbott have been compounded by two other factors:  the common victims of Covid-19 and the state’s demographic composition. Various studies have confirmed that Covid-19 infections and mortalities are disproportionately impacting Blacks [5] and Hispanics [6] in communities throughout the U.S.   For example, an analysis of recent Dallas County Covid-19 cases by UT Southwestern Medical Center revealed that Hispanics comprised 60 percent of all new cases while their county population was 40 percent. [7]  
Various explanations have been proposed to explain the heightened vulnerability of Blacks and Hispanics to Covid-19, including the types of jobs held (i.e., factories, food service); living in crowded situations with less options for social distancing; lack of Covid-19 testing; and skepticism about medical doctors.

The urgency of acting more quickly in Texas is compounded by the fact that Hispanics (39.2%) and Blacks (11.7%) collectively comprise half (50.9%) of the state’s population [8] — a demographic reality suggesting that the consequences of Covid-19 for these two segments of the Texas population are likely to be more severe as a result of Abbott’s continued failure to follow the advice of health experts.

To this point, there is evidence that Blacks and Hispanics are struggling more than whites and Asians to meet important daily needs since the pandemic started. In a major effort to help the nation monitor post-Covid-19 experiences on a weekly basis, the Census Bureau along with several federal agencies began surveys with samples of residents in 15 metropolitan areas and has made the results of these surveys available to the public.[9]  The survey, provided in English and Spanish, was designed as a timely and periodic measure of the impact of coronavirus (COVID-19) on the following topics:

  •         Employment status
  •          Food security
  •          Housing security
  •          Education disruptions
  •          Physical and mental well-being

Our analysis of the 1,586 surveys completed in the Dallas/Ft. Worth metropolitan area during the week of June 11, 2020 revealed the following race-ethnic differences on three of the topical areas:
·       Food security:  Hispanics (16.9%) and Blacks (15.5%) were more likely than whites (3.3%) and Asians (3.5%) to state that they were not at all confident about their ability to afford the kinds of food that they needed for the next four weeks.  Hispanics (12.4%) were more likely than whites (5.1%), Blacks (1.9%) and Asians (5.0%) to agree that it was often true that their children were not eating enough because they could not afford enough food.  Hispanics (15.8%) and Blacks (16.0%) were more likely than whites (6.5%) and Asians (2.3%) to agree that they sometimes/often did not have enough food to eat during the past seven days.
·       Employment status:  Hispanics (65.4%) and Blacks (51.9%) were more likely than whites (43.1%) and Asians (32.9%) to state that they or someone in their household had experienced a loss of employment income since March 3, 2020. In addition, Hispanics (48.5%) and Blacks (45.4%) were more likely than whites (24.0%) and Asians (17.8%) to state that they or someone in their household expected a loss of employment income over the next four weeks.
·       Housing security:  Hispanics (27.9%) and Blacks (30.8%) were more likely than whites (9.2%) and Asians (15.8%)  to state that they had no confidence/slight confidence that their household would be able to pay their next rent or mortgage payment on time.

Absence of a Safety Net

For Blacks and Hispanics, surviving the pandemic is analogous to avoiding a torpedo that has already been launched given their history of comorbidities, the jobs that they hold, and other limitations.  Their dilemma is further amplified by the absence of a safety net for healthcare, economic and social services.  Hispanic immigrants are especially vulnerable to the consequences of Covid-19 because they are:
·       Unable to participate in Medicare or Medicaid;
·       Unable to obtain Social Security benefits despite the millions in contributions that employees make annually;
·       Not eligible to obtain food stamps;
·       Not eligible for stimulus payments due to the pandemic;
·       Not eligible for unemployment benefits; and
·       Often working in hazardous environments since their employers are infrequently inspected by OSHA for compliance with Covid-19 standards.[10]
Making matters worse, the State of Texas has joined the Trump administration in requesting that the U.S. Supreme Court end Obamacare – a cruel action that will leave many Texans without the care that they need to recover from the devastation caused by the pandemic.  
Although some reports have indicated that the Covid-19 death rates are not increasing along with increasing infection rates, we should not take any comfort with this trend because race-ethnic information is often missing from death certificates.  The actual mortality rates for Blacks and Hispanics could be much higher than currently reported. [11]

A Different Approach to Stimulating the Texas Economy

The irony in Governor Abbott’s quest to stimulate the Texas economy is not lost here.  Would it not make better sense to more aggressively stop the spread of Covid-19, give residents the opportunity to restore their health and return to jobs at businesses that have been certified as safe from Covid-19 exposure? Texas Hispanics and Blacks, for example, comprise a large segment of the state’s workforce in various industries. Moreover, aggregate household income in 2018 — $184 billion for Hispanics [12] and $73 billion for Blacks [13] – represents a substantial contribution to the Texas economy. The increasing loss of Hispanics and Blacks from the Texas workforce due to Covid-19 infections and mortalities would substantially slow down the economy and possibly negate the progress expected by Abbott in re-opening business establishments.

In the absence of a safety net, it might be a good idea for private corporations in Texas to collectively create a special fund that could be used to support vulnerable groups like Blacks and Hispanics who need financial support during this difficult period. After all, the substantial consumer spending of these two segments has contributed to the profitability of many Texas retailers and manufacturers, such as Walmart, Mission Foods, Fiesta Supermarkets, Kroger, H-E-B, Sherwin-Williams, Home Depot, and various others.  The contributed funds could be distributed to Black and Hispanic families during this difficult period with the goal of maintaining their good health; returning to work in businesses that the state has certified as safe and free of Covid-19 exposure; and continuing their consumer spending at Texas businesses.  This makes more sense – scientifically and economically.

Final Message to Governor Abbott

The following recent quote in The Washington Post accurately summarizes the failure in leadership by Governor Abbott and other leaders that are following the same Covid-19 strategy:
“A record surge in new cases is the clearest sign yet of the historic failure in the United States to control the virus – exposing a crisis in governance extending from the Oval Office to state capitals to city council.” (Page 2) [14]
It is especially perplexing that the pandemic battle in Texas has been presented in news  stories as an ongoing fight between the Governor and judges in Dallas and Harris counties – a pattern that has muted the voices of the Hispanic and Black communities where the virus is likely to have the most devastating impact. The media should assume more responsibility for including the voices of Hispanic and Black leaders in Texas who are supporting the scientific solution that has been advocated by Judge Jenkins and Judge Hidalgo. They could use some help.  
  
Governor Abbott, you have a responsibility to protect the lives of all Texans without delay, especially during a pandemic.  You should forget about party loyalty and act decisively according to the advice of the nation’s health experts.  In case you forgot, start by ordering the following:
·       Mandate the use of face masks in public and impose fines on people that refuse to obey the law;
·       Discipline public officials that refuse to comply with the law;
·       Re-institute the stay-at-home order;
·       Close dining options at restaurants and allow only take-out or delivery;
·       Prohibit the use of group meetings in public facilities (i.e., conventions) and encourage churches to conduct virtual masses instead of masses attended by their membership;
·       Allow schools to open only if they are required to use face masks and adhere to social distancing guidelines. Older or more vulnerable teachers should be assigned to teach online classes;
·       Authorize more financial resources to expand the state’s testing capabilities to avoid the long lines and waiting periods for residents who are becoming increasingly motivated to measure their Covid-19 exposure;
  •  Launch a public relations campaign that shows all public officials wearing a mask and reminding Texas residents that wearing a mask is required by law and not an option. Going forward, the campaign should avoid using the familiar phrase “Wearing a face mask is a good idea” and replace it with a clearer message like “Wearing a face mask is a life or death issue – obey the law;” and
  • Lastly, consider placing Dallas County Judge Clay Jenkins and Harris County Judge Lina Hidalgo to lead a Covid-19 commission composed of the state’s top healthcare experts to manage the state’s Covid-19 strategy going forward. Both judges have been more forceful in warning Governor Abbott against re-opening Texas businesses and showing the appropriate respect for science to protect the health of Texas residents.  Importantly, the unbiased and more objective management of the Covid-19 strategy by this commission should ensure that political considerations are removed from future decisions related to the distribution of Covid-19 treatments and vaccines as they become available.   

End Notes


[1]  Champagne, S.R. (2020 June 25). Gov. Greg Abbott pauses Texas’ reopening, bans elective surgeries in four counties to preserve bed space for coronavirus patients. Texas Tribune. Accessed at: https://www.texastribune.org/2020/06/25/texas-elective-surgeries-coronavirus-greg-abbott/
[2] Champagne, S.R. (2020 June 25). Ibid.
[3]Texas Department of State Health Services, DSHS Covid-19 Dashboard, Data reported as of June 27, 2020. Accessed at: https://txdshs.maps.arcgis.com/apps/opsdashboard/index.html#/ed483ecd702b4298ab01e8b9cafc8b83
[4]Goodman J.D. (2020 June 24). N.Y. Will Impose Quarantine on Visitors From States With Big Outbreaks,  Accessed at https://www.nytimes.com/2020/06/24/nyregion/ny-coronavirus-states-quarantine.html
[5]  Associated Press (2020 June 19). OVID-19 Is Ravaging America’s Vulnerable Latino Communities, New York Times. Accessed at:  https://www.nytimes.com/aponline/2020/06/19/us/ap-us-virus-outbreak.html
[6] Ollove, M. & Vestal, C.  (2020 May 27)  COVID-19 Is Crushing Black Communities. Some States Are Paying Attention. Accessed at: https://www.pewtrusts.org/en/research-and-analysis/blogs/stateline/2020/05/27/covid-19-is-crushing-black-communities-some-states-are-paying-attention
[7] Hacker, H.K., Ambrose, S. and Keomoungkhoun, N. (2020 June 22) ‘Alarming’ trend of Dallas County COVID-19 cases could worsen by Fourth of July, UTSW experts say UT Southern Medical Center. Dallas Morning News. Accessed at: https://www.dallasnews.com/news/public-health/2020/06/22/ut-southwestern-experts-predict-surge-in-coronavirus-cases-hospitalizations-before-fourth-of-july/
[8]Census Bureau (2018).  ACS Demographic and Housing Estimates, Table DP05, 2018 5-Year Estimates. Accessed at www.data.census.gov.
[9]  U.S. Census Bureau. Measuring Household Experiences during the Coronavirus (COVID-19) Pandemic Accessed 5-29-2020 at: https://www.census.gov/householdpulsedata
[10] Held, L. (2020 June 16).  OSHA faulted for not doing more to protect workers from Covid-19. Civil Eats, accessed at https://civileats.com/2020/06/16/osha-faulted-for-not-doing-more-to-protect-workers-from-covid-19/
[11]  Rincon, E.T. (2020, April 16).  Missing Race-Ethnicity Data Complicates Covid-19 Mortality Counts, But the Solution is Simple. Accessed at: https://www.blogger.com/blogger.g?blogID=4666951909336256447#editor/target=post;postID=242538682071119357;onPublishedMenu=template;onClosedMenu=template;postNum=2;src=postname
[13] Census Bureau. Aggregate income in the past 12 months – Hispanic households. Table B19313.  Accessed at: www.data.census.gov
[14] Hawkins, D., Birnbaum, M., Kornfield, M., O’Grady, S., Copeland, K. Lati, M. and Sonmez, F. (2020 June 29). Arizona, Florida, Texas are latest coronavirus epicenters. The Washington Post. Accessed at:  http s://www.washingtonpost.com/nation/2020/06/28/coronavirus-live-updates-us/

Does Unconscious Bias Explain Police Brutality?

National and global attention has shown a spotlight on the brutal killing of George Floyd – an unarmed black man who died when Officer Derek Chauvin pressed his knee against Floyd’s neck for an estimated eight minutes and 45 seconds while other officers looked on without intervening.  Although Officer Chauvin has been charged with second degree murder, protests continue to advocate for police reforms to stop these needless killings.  Indeed, the historical record reveals that law enforcement throughout the U.S. has all but declared open season on Black males. For example, a Tulsa Police Department Division Commander, Major Travis Yates, recently explained that African Americans probably ought to be shot more often based on the amount of contact that they have with the police.[i]
In the ensuing debates about police reforms, unconscious bias training has emerged as one potential strategy. But what is “unconscious bias”?   Following is one simple definition:

Unconscious biases, also known as implicit biases, are the underlying attitudes and stereotypes that people unconsciously attribute to another person or group of people that affect how they understand and engage with a person or group.”  [ii]

The key term here is “underlying” which suggests that the individual may not be aware of these attitudes and stereotypes.  For example, gender bias is the tendency to prefer one gender over another gender.  Confirmation bias is the inclination to draw conclusions about a situation or person based on your personal desires, beliefs and prejudices rather than on unbiased merit.  Although there are different types of unconscious bias, they share one thing in common:  a lack of awareness or consciousness by the individual who may later choose to act on these beliefs.
Regardless of the type of unconscious bias under consideration, I do not buy the argument that people are not conscious of their “underlying” attitudes and stereotypes – as if their behavior deserves to be forgiven or not disciplined due to an alleged lapse in memory or consciousness.  The following three examples will hopefully make my point.
  
Training Police on Using Pepper Spray
A news article in The Dallas Morning News described an unusual training program at the Cambridge police academy on the appropriate use of pepper spray when apprehending Mexican American suspects. [iii]  Police academy trainers were instructing new cadets to use stronger doses of pepper spray on Mexican American suspects. Officer Gutoski, the department training officer, explained their rationale in rather un-scientific terms: “Mexicans grow up eating too much spicy food, and because they spend so much time picking hot peppers in the fields….so with Cajuns, Mexican-Americans, Pakistani, Indian…what happens is that pepper spray is effective for a much shorter time.”  Even more unnerving is the explanation by departmental spokesman, Frank Pasquarello, that “Officer Gutoski was repeating information that’s shared all the time among officers in informal training sessions on the use of pepper spray.”   The training program might have been considered an act of “unconscious bias” if not for the fact that it was part of the approved training program.
Is Racial Profiling on the Decline?
A recent analysis of traffic stops made by the Texas Highway Patrol revealed that racial profiling of Hispanics was on the decline, although critics suspected that the Department of Public Safety was deliberately misclassifying Texas drivers that they stopped in order to lower the state’s racial profiling statistics. [iv] Further analysis, however, revealed that the DPS troopers were assigning the race category based on the physical characteristics of the drivers, rather than simply asking each driver to identify themselves by race or ethnicity. To achieve the lower racial profiling statistics, troopers apparently found it convenient to classify Hispanic drivers as white. Was this unconscious bias?  Perhaps not since the misclassifications by race-ethnicity were not random and designed to achieve one objective:  to lower the racial profiling statistics in Texas.
Just a Cup of Coffee

A Starbucks shop in Pennsylvania received national attention regarding the mistreatment of two Black men who were asked to leave the premises even though they were just waiting for a meeting to take place.  The Starbucks manger called police to remove the two men from the premises.  The CEO of Starbucks wasted little time in personally apologizing to the two black men for their discriminatory treatment and announced that all Starbucks employees would be required to attend a workshop to identify and remediate unconscious bias.
In my view, the Starbucks manager in Philadelphia that requested police action to remove the two black customers was not motivated by “unconscious bias,” but rather by conscious beliefs and prejudices against blacks that were not detected in the screening process by Starbucks staff.  While it is common practice for organizations to screen applicants for job skills, personality, career and criminal background, it seems that screening for beliefs and attitudes about blacks and Latinos should also be part of the hiring process.  
Does cultural knowledge or awareness influence medical treatment?

One recent study explored the trend in pain management wherein whites were more likely than Blacks to be prescribed strong pain medications for equivalent treatments.[v]  Researchers at the University of Virginia quizzed white medical students and residents to learn how many believed inaccurate statements about biological differences between the two races – such as “black people’s blood coagulates more quickly,” “Blacks’ skin is thicker than whites’,” and “Blacks’ nerve endings are less sensitive than whites.’ ” Although they expected some endorsement of these statements, the investigators were surprised that so many in the group with medical training endorsed such beliefs. It was discovered that those who held false beliefs often rated Black patients’ pain lower than that of white patients and made less appropriate recommendations for the treatment of their pain. 
Does Unconscious Bias Help Us Understand Police Brutality?
It is not likely that Officer Chauvin experienced unconscious bias while he forced his knee on Floyd’s neck for eight minutes and 45 seconds.  It is more likely, based on his past behavior, that he intentionally and consciously killed Floyd.  Officer Chauvin should have been removed from policing a long time ago, and it is not likely that any amount of unconscious bias training could have changed his animosity towards blacks. Such individuals pose a danger to the safety of all residents, especially people of color.
Beliefs, prejudices or stereotypes about people of color are a consequence of many factors – family values, a past negative experience, media stereotypes, and growing racial segregation in residences, churches, schools, and social networks – factors that are very resistant to change. In addition, the current political climate in the U.S. has “normalized” racist commentary and behaviors towards blacks and Latinos, making it much easier to mistreat these groups.  In 2018, there were 7,120 hate crime incidents in the U.S. with a majority of the reported hate crimes motivated by race, ethnicity or ancestry bias (59.6 percent). [vi]  (See Figure 1 below)

Figure 1

Conclusion
  The prevalence of hate crimes based on race, ethnicity or ancestry should serve as a loud warning bell to employers that current employees and new hires, especially armed police officers, should be vigorously investigated for past experiences and current attitudes related to people of color. Once the presence of these negative attitudes or stereotypes is confirmed, these individuals should not be hired. Current employees should be removed from the organization or re-assigned to a position that does not require interaction with the public. Indeed, it is insufficient to simply conclude that a person shows evidence of unconscious bias that is potentially harmful and expect that a workshop will magically remediate their hostility towards Blacks, Latinos or Asians.  
End Notes

[i] Li, D.K.   (2020, June 11).  African Americans ‘probably ought to be’ shot more by police, a top Tulsa officer said. NBC News. Accessed at https://www.nbcnews.com/news/us-news/african-americans-probably-ought-be-shot-more-police-top-tulsa-n1229981
[iii] Dallas Morning News (1999, August 14).  Pepper spray remarks backfire on department. Cited from  Los Angeles Times.
[iv] Rincón, E. T. (2016). How DPS can improve its system of recording race/ethnicity during traffic stops.  Dallas News, Jan. 2016. Available at https://www.dallasnews.com/opinion/commentary/2016/01/27/edward-t.-rincon-how-dps-can-improve-its-system-of-recording-raceethnicity-during-traffic-stops
[v] Hoffman, K.M., Trawalter, S., Axt, J.R., and Oliver, M.N.(2016, April 19).  Racial bias in pain assessment and treatment recommendations, and false beliefs about biological differences between blacks and whites.  PNAS Vol. 113 No. 16.

[vi]  McCarthy, N. (2019, November 13).  U.S. Hate Crimes Remain At Heightened Levels. Statistica. Accessed at https://www.statista.com/chart/16100/total-number-of-hate-crime-incidents-recorded-by-the-fbi/

Missing Race-Ethnicity Data Complicates Covid-19 Mortality Counts, But the Solution is Simple

Recent news reports about mortality counts for the Coronavirus point to the potential of large under-counts due to the exclusion of deaths occurring at homes and the classification of causes of death in the frenzied environment of so many deaths occurring in communities. [i]

In addition, national reviews are showing that black mortality rates are much higher – sometimes twice as much – as their representation in the population for several communities such as Michigan, Illinois, North Carolina and South Carolina. [ii] Relatively less information has been provided in national news reports regarding mortality rates for Latinos.    
Recognizing these racial disparities, elected officials in Texas are pressing Governor Greg Abbot to form an emergency task force to evaluate racial disparities surrounding the coronavirus pandemic since several Texas cities are reporting that the disease is disproportionately affecting black residents. [iii]  Large gaps in data collection, however, exist at the county and state level, meaning that the full picture is unclear.  In response to these concerns, the Governor’s office offered no comment and continues its policy of not mandating the collection of this critical information.  As the Texas elected officials emphasized, the demographic data regarding Covid-19 mortalities is needed to guide resources to the more vulnerable communities or “hot spots” in the state.
Unfortunately, accurate estimates of Covid-19 mortality rates by race-ethnicity are systematically under-estimated because so many of the deaths are not being classified by race-ethnicity.  The absence of race-ethnic data undermines the planning of intervention strategies since it is fairly well understood that identifying clusters of infected persons can expedite a quick intervention and solution to the spread of the virus.
Thus far, the knowledge that blacks have higher Covid-19 mortality rates compared to their population in a community has been attributed to the confluence of co-morbidities like diabetes, high blood pressure, obesity, and higher prevalence of cardiovascular disease. Less attention has been devoted, however, to the influence of social determinants of health – that is, black people tend to live in poor areas that include poor access to healthy foods and healthcare providers.[iv] There could be other correlates that are equally important in explaining these high mortality rates, such as lack of knowledge about the virus, negative attitudes towards healthcare providers, religious beliefs, fear of family separation, and other psychological factors.

An Important Question to Ponder
Given the gravity of the high mortality rates among blacks and Hispanics, and the real possibility that they could be higher and likely to spread the virus more rapidly in these vulnerable communities, why have public officials not mandated the collection of race-ethnic information for Covid-19 infected persons and mortalities?   
Thus far, the explanations appear to rest on the assumption or belief that the sheer volume of mortalities does not allow sufficient time to demographically classify the corpses.  While this theory may be true, following are a few examples from my research practice that illustrate the consequences of policies that utilize inaccurate race-ethnic information or appear indifferent to its inclusion. In general, the solutions were not complicated nor time consuming.

Is Racial Profiling on the Decline?:
A recent analysis of traffic stops made by the Texas Highway Patrol revealed that racial profiling of Hispanics was on the decline, although critics suspected that the Department of Public Safety (DPS) was deliberately misclassifying Texas drivers that they stopped in order to lower the state’s racial profiling statistics. [v]  Further analysis, however, revealed that the DPS troopers were assigning the race category based on the physical characteristics of the drivers. For example, by classifying Hispanic drivers as “white,” the racial profiling statistics were systematically lowered in the State of Texas. The recommended solution was to simply ask each driver to self-identify their race or ethnicity by choosing from a card with standard race-ethnic categories that could be presented by the DPS trooper. [vi] 

Relying on Surnames:  A Legal Matter
In a Dallas County murder trial that engaged me as an expert witness, the defense attorney had requested a change of venue because he felt that a fair trial was not possible for his Hispanic client. Why? Because the share of Hispanics in the jury pool was likely to be substantially different from the Hispanic share of the county’s population. I was asked to conduct a statistical analysis to address this issue; however, the race-ethnic information recorded by the court for jury pool members was considered unreliable for the analysis because it was inconsistently recorded. A surname was the only information available to estimate the Hispanic ethnicity of jury pool members at an estimated accuracy of 75 percent.  A change of venue was justified since the estimate of Hispanics in the jury pool was not reflective of their representation in the County’s population.  Clearly, a different legal outcome might have resulted if the venue had not changed.

The Mystery Surrounding the Causes of Asian Mortalities
Information about the leading causes of mortality among Asian American subgroups have been few in epidemiological studies because (a) only seven states collected Asian subgroup information on death records before 2003, (b) coroners were more likely to make race-ethnic classification errors for Asian Americans (13%) and Hispanics (7%) and (c) national health surveys did not report data for Asian American subgroups. [vii] As a result, misleading and erroneous conclusions were often made due to the omission of Asian respondents resulting from small sample sizes, or the aggregation of data that masked important differences among the Asian subgroups. For example:
·       Asian Indians have greater coronary heart disease risk than Chinese persons when compared to non-Hispanic whites;
·       Japanese have greater risk for incident cancers while Asian Indians have the lowest risk;
·       Liver cancer mortality rates are higher for Vietnamese, Koreans and Chinese when compared to other Asian American subgroups and non-Hispanic whites.
·       Colorectal cancer rates are particularly higher for Japanese and exceed the rates for non-Hispanic whites and all other Asian subgroups.
The study investigators also discussed the results of recent pharmacogenomics studies that document how some Asian American subgroups respond differently to a variety of drug treatments, including chemotherapy, anti-coagulants, anti-platelets, and anticonvulsants. The inclusion of Asian subgroup categories in major health surveys and in the processing of medical information has greatly expanded medical knowledge and treatment related to Asian subgroups.  At least in the medical arena, the study investigators clearly illustrated that carelessness or indifference to the use of Asian subgroup identities can have significant consequences. 
Thus, it should be obvious that missing or inaccurate race-ethnic information can have serious consequences to our quality of life and should not be dismissed so easily by public officials who believe that it requires a great investment of time.

Current Technology Points to a Simple Solution for the Covid-19
In the absence of information regarding the race-ethnic background of a given population, we can take comfort in knowing that it is now possible to classify the race-ethnic background of an individual based on their first name, last name and their residential zip code.  Ethnic Technologies developed a proprietary classification system called E-Tech 2020 [viii] which has been utilized in several survey studies that I have conducted in past years.  In one national study of black, Latino and Asian consumers in the U.S., race-ethnicity information was missing and presented a major barrier to the sample design and planning of the survey.  The E-Tech tool was used to estimate a race-ethnic category in a database of 200,000 household addresses that allowed us to plan the appropriate language for the questionnaires and manage a team of telephone interviewers with the relevant language skills.  The completed surveys that we received confirmed that the accuracy of the assigned race-ethnic category using the E-Tech tool was 80-90 percent when compared to the self-reported race-ethnicity of the survey respondents.  Self-identification has usually been found to be a more valid measure of a person’s race and ethnicity, while surname and language preference have also been used although considered less valid measures. [ix]  In a more recent review and analysis using geo-coding and surnames to estimate race and ethnicity, the investigators concluded that the combined approach can yield positive predictive values of 80 percent, thereby offering a viable means for assigning race and ethnicity for the purpose of examining disparities in care until self-reported data can be systematically collected. [x] While not a perfect measure, the E-Tech tool has been shown to be quite useful in my past research experience.
What is the relevance of the E-Tech tool for the Covid-19 situation?  Simply, it can drastically reduce the amount of time needed to identify the likely race-ethnic categories for a listing of mortalities that includes their names and addresses.  Moreover, the E-Tech tool is affordable and likely to fit most public agency budgets.  By using this service, public officials could more readily identify clusters of vulnerable populations, such as blacks and Latinos, that require immediate intervention to minimize the spread of the coronavirus.  While the accuracy of the E-Tech tool in estimating a person’s race-ethnic classification is not 100 percent, it nevertheless presents a significant advantage over the current system of delays and backlogs that are typical in public agencies.  
I challenge Gov. Abbott and other public officials to mandate the classification of race-ethnicity for all Covid-19 infections and mortalities using the E-Tech tool or perhaps another service that accomplishes similar results. Indeed, this action would illustrate true leadership in our collective efforts to stop the threat of this deadly virus.


Reference Notes


[i] Gillum, J., Song, L. and Kao, J.  (2020, April 14).  There’s been a spike in people dying at home in several cities. That suggests coronavirus deaths are higher than reported.  Accessed on 4-15-20 at https://www.propublica.org/article/theres-been-a-spike-in-people-dying-at-home-in-several-cities-that-suggests-coronavirus-deaths-are-higher-than-reported
[ii] Ray, R.  (2020, April 9).    Why are Blacks dying at higher rates from COVID-19?  The Brookings Institution. Accessed on 5-15-20 at https://www.brookings.edu/blog/fixgov/2020/04/09/why-are-blacks-dying-at-higher-rates-from-covid-19/
[iii] Morris, A.  (2020, April 14).  Texas elected officials push for emergency response to racial disparities emerging in Covid-19 pandemic.  The Dallas Morning News, accessed on 4-14-20 at https://www.dallasnews.com/news/public-health/2020/04/14/texas-elected-officials-push-for-emergency-response-to-racial-disparities-emerging-in-covid-19-pandemic/
[iv] Yancy, C.W. (2020, April 15). Covid-19 and African Americans. JAMA Network. Access on 4-15-20 at https://jamanetwork.com/journals/jama/fullarticle/2764789
[v] Rincón, E. T. (2016). How DPS can improve its system of recording race/ethnicity during traffic stops.  Dallas News, Jan. 2016. Available at https://www.dallasnews.com/opinion/commentary/2016/01/27/edward-t.-rincon-how-dps-can-improve-its-system-of-recording-raceethnicity-during-traffic-stops
[vi] Ibid.
[vii] Holland, A.T. & Palaniappan, L.P. (2012, June 22). Problems in the collection and interpretation of Asian-American health data: Omission, aggregation, and extrapolation.  Ann. Epidemiol. 2(6).
[viii]Ethnic Technologies, accessed on 4-16-20 at  https://www.ethnictechnologies.com/.
[ix]Rincón, E. T. (in press).  The Culture of Research, Writers Marq, Dallas, Texas.
(x)  Fiscella, K. and Fremont, A.M. (2006).  Use of geocoding and surname analysis to estimate race and ethnicity. Health Services Research, 41-4, Part I. Access on 4-17-20 at https://www.ncbi.nlm.nih.gov/pmc/articles/PMC1797082  

Undermining the 2020 Census: Trump’s Toxic Brew of Crime, Hysteria and Immigrants

In a recent news story, The New York Times tells us that the Trump administration is sending elite tactical Border Patrol teams (BORTRAC) to sanctuary cities that “release dangerous criminal aliens to prey upon the public.” [i]  Sanctuary cities are targeted because local officials have refused to provide  support to ICE in enforcing immigration policies that are perceived as pushing undocumented people further into the shadows, making cities less safe as immigrant become less likely to report crimes or cooperate with investigations.
These BORTAC agents are accustomed to engaging in armed confrontations with drug-smuggling suspects using armored vehicles. They act as the SWAT team of the Border Patrol using such gear as stun grenades and enhanced Special Forces-type training. The officers usually target individuals who are known to be violent with extensive criminal records. Local officials have voiced concerns about the increased militarizing of their communities that could also have deadly consequences. The interventions also result in “collateral arrests” involving innocent family members.    
   
This terror campaign against sanctuary cities is broad in its scope and includes large cities like Chicago, New York, San Francisco, Los Angeles, Atlanta, Houston, Boston, New Orleans, Detroit and Newark, N.J. The map[ii]below, produced by The Center for Immigration Studies, shows the current distribution of sanctuary counties (yellow), cities (red) and states (green) throughout the U.S.  Importantly, there are many communities throughout the U.S. with substantial numbers of immigrants that are not sanctuaries and thus excluded from this map.
Figure 1: Distribution of Sanctuary Cities, Counties and States, 2020
Source:  Center for Immigration Studies, February 2020.

Interestingly, it is no coincidence that the BORTRAC agents are being deployed from February  through May of this year – the same period of time that the 2020 Census is being conducted.   Previously, the Trump administration also worked feverishly to include a citizenship question in the 2020 Census questionnaire which was rejected by the courts due to its potential to discourage response rates of the nation’s immigrant population. Similarly, the deployment of BORTRAC agents is designed to create fear and anxiety among immigrants in sanctuary cities that is likely to discourage participation in the 2020 Census. 
Why does this matter?  Because access to millions of federal dollars by cities throughout the nation are jeopardized by a Census under-count – funds that are used to support schools, hospitals, roads and highways, and other infrastructure needs. The irony is that a Census under-count will impact not just sanctuary cities, but many communities with substantial immigrant populations that are not sanctuaries.  For example, Dallas County is not included in the list of sanctuary counties, but it is estimated that $40 million in federal funds will be lost for every 1 percent drop in the Census response rate. [i]

To justify this reign of terror, the Trump administration explains that the elite agents will assist the targeted communities in handling “dangerous criminal illegal aliens” that are being protected by sanctuary cities. The facts about immigrant crime, however, have established over numerous studies that immigrants do not increase local crime rates, are less likely to cause crime and less likely to be incarcerated than their native-born peers – important facts that were included in a recent review by The Cato Institute regarding immigrant crime rates in the U.S. and the State of Texas. [ii]  In their in-depth analysis of data from the Texas Department of Public Safety, Institute investigators analyzed the arrests and convictions for the year 2015 to determine the extent to which different crimes were conducted by illegal immigrants, legal immigrants and the native born.  The conclusion from their analysis, quoted below, provides concrete evidence that the Trump narrative about “dangerous criminal aliens” is false and misguided:
“The homicide conviction rate for illegal immigrants was 16 percent below that of native-born Americans in Texas in 2015. The conviction rates for illegal immigrants were 7.9 percent and 77 percent below that for native-born Americans for sex crimes and larceny, respectively.  For all criminal convictions in Texas in 2015, illegal immigrants had a criminal conviction rate 50 percent below that of native-born Americans.  Legal immigrants had a criminal conviction rate 66 percent below that of native-born Americans.”  (p.5)
Crime, therefore, is merely a pretext for justifying the deployment of BORTRAC agents in sanctuary communities – a pretentious show of force whose only purpose is to discourage participation of immigrants in the 2020 Census and enhance the political positioning of the Republican party.
Also lost in the campaign to target sanctuary cities are the substantial contributions made by immigrants,  both legal and undocumented, to the U.S. economy, the defense of our nation in times of war, the many patents for inventions at U.S. academic institutions, keeping the Social Security system solvent, and the numerous jobs created by entrepreneurs. [iii]
The Trump administration and the GOP have demonstrated an uncanny ability of fortifying their political power by implementing draconian policies that punish immigrant families and the public entities that value and support immigrants. I am hopeful, nonetheless, that the supportive network of sanctuary cities, counties and states will remain steadfast in their support and maintain careful vigilance over the newly deployed tactical agents to discourage the use of aggressive or violent behavior towards immigrant residents. Non-sanctuary cities should be equally concerned about the potential loss of federal dollars in their communities as well since the deployment of BORTRAC agents will be communicated by news media throughout the nation.
In the meantime, the Census Bureau will be doubly challenged to ensure an accurate count in the 2020 Census as Trump’s elite forces are deployed in the sanctuary cities. To minimize potential confrontations with ICE and Trump’s elite forces, perhaps immigrants should be strongly encouraged to complete the online version of the Census questionnaire on their smart phones, home computers or other devices. Trump should not be handed a victory by allowing his elite forces to suppress Census participation, depriving communities of important federal funds, and shaping the balance of political representation.
U.S. residents should realize that when immigrants lose, we all lose.       

Reference Notes

[i] Dallas County, Texas (2018). Request for Proposal for 2020 Census Participation Initiative for Dallas County, Page 21.
[ii] Nowrasteh, A. (2018).  Criminal immigrants in Texas:  Illegal immigrant conviction and arrest rates for homicide, sex crimes, larceny, and other crimes. Immigration Research and Policy Brief No. 4, The Cato Institute. Accessed at https://www.cato.org/publications/immigration-research-policy-brief/criminal-immigrants-texas-illegal-immigrant
[iii] Rincón, E. T. (2017). Sanctuary city politics:  Wolves in sheep’s clothing.  TribTalk – Perspectives on Texas. A Publication of the Texas Tribune.  Accessed at https://www.tribtalk.org/2017/02/13/sanctuary-city-politics-wolves-in-sheeps-clothing/


[i]Dickerson, C. and Kanno-Youngs, Z. (2020).  Border Patrol will deploy elite tactical agents to sanctuary cities. The New York Times, accessed at https://www.nytimes.com/2020/02/14/us/Border-Patrol-ICE-Sanctuary-Cities.html
[ii]Griffin, B. and Vaughan, J.S. (2020). Center for Immigration Studies, accessed at https://cis.org/Map-Sanctuary-Cities-Counties-and-States

What hurts South Dallas more – crime or the hasty reporting of crime?

A recent headline in The Dallas Morning News sent its readers a chilling message: “Dallas has had 200 murders in 2019. Here’s what that means.” [i] It reminded everyone of the unfortunate consequences of urban growth and the absence of sensible gun control. With 40 homicides recorded for the month of May according to news reports,[ii] Chief of Police Hall requested that Gov. Gregg Abbott send state troopers to assist the under-staffed Dallas Police Department to help control the alarming rise in homicides.[iii] 

Although few specifics were provided on the type of support that the state troopers provided,[iv] news reports indicated that it was focused on the South Dallas community, that community residents felt that the troopers presence did more harm than good and created a sense of distrust.[v] This sense of distrust of DPS troopers was underscored by the slaying of a black resident in South Dallas who was stopped for failing to signal a turn.[vi] Although conflicting reports emerged about whether the victim had drawn a gun or not, the Texas Department of Public Safety declined to release video footage of the incident, and the two state troopers were not indicted for the incident.  The victim had been shot 16 times by the state troopers – five times in the front and four times in the back of his torso according to the autopsy report.

This is not the first time that South Dallas has been singled out in reports related to increased crime.  Interestingly, the Dallas Morning News story further explained that the “majority of homicides occurred in South Dallas zip codes” but did not provide its readers any detailed crime statistics to support this conclusion.[vii]
Adding fuel to the fire was a recent study of South Dallas published in Urban Science [viii]by two social scientists who concluded that “South Dallas is safer than only 13% of the cities in Texas and there is a 1 in 17 chance of becoming a victim of any crime.”
In providing such a disparaging picture of South Dallas, one would hope that journalists and social scientists are doing their due diligence in analyzing crime data.  Unfortunately, that is not always the case.  
Indeed, other independent analyses provide a different picture of crime in South Dallas. For example, D Magazine[ix][x] and NBC 5[xi] recently released news stories that addressed the pattern of homicides by including a map of City of Dallas 2019 homicides produced by Robert Mundinger (www.themap.net). According to these stories, homicides were “pretty much everywhere.” Figure 1a below displays the map of homicides included in the NBC 5 story which illustrates the wide dispersion of homicides throughout the City of Dallas, which is similar to the map included in the D Magazine stories on the same topic.  While the map provides a general illustration of the distribution of homicides, it lacks important information about the boundaries that define which city council districts are included in the South Dallas and non-South Dallas sectors.

I produced the map below (Figure 1b) which presents the current city council district boundaries and council person names to better illustrate the geographic distribution of homicides, especially when drawing conclusions about the concentration of such crimes between South Dallas and non-South Dallas districts.

Figure 1b:  Distribution of Homicides by Dallas City Council Districts (N = 161)


Neither of these two maps, however, display all of the homicides for 2019 since complete information was available only for 164 cases in Figure 1a and 161 cases in Figure 1b when these maps were produced. These missing cases, of course, could change the overall pattern of homicides displayed by these two maps.
In addition to the lack of geographic precision in previous news reports, I decided to verify the 2016 crime rates in South Dallas reported in Urban Science by the two social scientists. My statistical analysis of 2016 violent and property crime rates using Dallas Police Department data revealed that the South Dallas crime rates reported in the Urban Science article were highly inflated and not supported by the sources that were cited in the published study. My analysis also confirmed that violent and property crimes were distributed throughout the City of Dallas and not overly concentrated in South Dallas.[xii]
Why the contradictory picture of homicides in South Dallas?  The contradictory picture of homicides may result from several factors. First, it is likely that the rush to report changes in homicide rates that reinforce pre-existing perceptions of crime in South Dallas may be one factor that precludes a more careful analysis of crime patterns. Secondly, South Dallas is composed of several council districts whose crime patterns can vary considerably.  Thirdly, Dallas County – whose population consists mainly of the City of Dallas — is among the top ten fastest growing counties in the U.S.[xiii], suggesting that an increase in the number of homicides could be a consequence of population growth as well.   

The consequences of inconsistent crime reporting are problematic for several reasons.  It is well known, for example, that the perception of high crime rates in urban communities has been a key factor in slowing their economic development.[xiv]  While some neighborhoods in urban communities may indeed show high crime rates, is it fair to stigmatize an entire community based on crime incidences in smaller neighborhoods?  Moreover, is it fair to stigmatize a community based on inaccurate or inflated crime rates?  Perhaps a closer look at crime patterns in the City of Dallas may help us to re-think what we currently know about crime rates in South Dallas.     
A closer look at the pattern of homicides in the City of Dallas challenges conventional thinking about crime. A more complete picture of 2019 homicides was obtained by accessing the Dallas Police Department’s NIBRS reports of crime activity dated as of 12-31-19.[xv]  Figure 2 below presents the distribution of the 207 homicides by council districts located in the South Dallas and non-South Dallas sectors of the city. From this chart, it is clear that a slight majority (56.0%) of the homicides occurred in the South Dallas districts, while less than half (44.0%) of the homicides occurred in the non-South Dallas districts.

Interestingly, the number of homicides varied greatly within the two sectors. For example, a higher number of homicides occurred in District 4 (n=34), District 7 (n=30), District 8 (n=23), District 2 (n-22), and District 10 (n=17).  In addition, several of the districts in the South Dallas sector revealed a relatively low number of homicides (District 1 (n=8), District 5 (n=11), and District 3 (n=10) when compared to some districts in the non-South Dallas sector.  Thus, individual districts in the non-South Dallas sector are also contributing to the overall number of 2019 homicides. However, what are the relative changes in the overall share of homicides since 2018 for the South Dallas and non-South Dallas sectors? This answer to this question is addressed by Figure 3 below. 

Figure 3 compared the change in the percent of total homicides between 2018 and 2019.  It is evident that the share of homicides in South Dallas districts declined from 66.5 percent in 2018 to 58.0 percent in 2019, while the share of homicides in non-South Dallas districts increased from 39.0 percent in 2018 to 47.0 percent in 2019. Thus, council districts in the South Dallas sector appear to be making progress in reducing their share of total homicides in 2019, while an increasing share of 2019 homicides has shifted to districts in the non-South Dallas sector – an important trend that should not be overlooked in future interventions by state and city leaders.
Figure 4 below examines changes in the number of homicides from 2018 to 2019 for each council district. First, the net change in homicides was considerably less (n=7) for the South Dallas districts when compared to the non-South Dallas districts (n=30).  It is particularly noteworthy that during this one-year period, three of the South Dallas districts showed decreases in the number of homicides, while most non-South Dallas districts showed increases in the number of homicides.    Indeed, only one non-South Dallas district (District 6) showed a decrease in the number of homicides.  Based on this analysis, it seems that the recent deployment of state troopers was misguided by the singular focus on the South Dallas community.
Lastly, I was curious about the geographic distribution of the 40 homicides that were previously reported for May of 2019 and used as justification by City leaders to invite DPS trooper support from Gov. Gregg Abbott.  In searching the same sources of police incidents used in this report, only 25 homicides were confirmed for May of 2019. Table 1 below summarizes the geographic distribution of these 25 homicides.
Table 1:  Distribution of Homicides for May 2019
District
No. Homicides
South Dallas
District 1
1
District 4
6
District 7
5
District 8
1
Subtotal
13
Non-South Dallas
District 6
3
District 9
3
District 10
1
District 11
2
District 12
2
District 14
1
Subtotal
12
 
As is readily apparent from Table 1, the number of homicides in the South Dallas and non-South Dallas sectors were nearly identical.  Consequently, one is left to wonder why the state troopers focused their intervention primarily on South Dallas.
Conclusion:  In summary, it seems that some improvement is needed in the manner that crime is analyzed as well as decisions that are based on these analyses.  In the case of social scientists, there is really no excuse for inflating crime statistics using unreliable sources.  Crime reports that lack geographic detail are likely to lead to misguided interventions, such as the state troopers that were sent to the South Dallas community that perhaps should have been directed to other non-South Dallas council districts that were experiencing relatively more increases in the number of homicides since 2018.
It might also be a good idea to recognize districts that show yearly progress in reducing the number of homicides or at least not showing any increases in the number of homicides.  Both journalists and social scientists need to exercise greater care in reporting crime trends in general, but particularly for communities like South Dallas whose quality of life has been negatively impacted by incomplete or inaccurate crime reports. Indeed, the sources of crime data used in this report are publicly available and not overly complex to analyze. 
The recent announcement by Chief Hall[xvi] about initiating a “predictive policing” plan offers some promise for reducing  crime by creating an intelligence-led policing unit that will “produce regular reports to forecast trends, identify patterns, and facilitate a more accurate picture of who is committing a crime and where….it will also generate a list of known offenders, active gang members, parolees, and sex offenders for each focus area.”  Some activists and community members, however, expressed skepticism and felt that the new plan will lead to racial profiling and more aggressive police tactics towards the victims of crime.
The predictive police plan, coupled with a more careful analysis of the geographic distribution of crime patterns, should help to direct interventions to the communities that show the greatest need – not just the usual suspects.
  
Reference Notes


[i]Garcia, N. (2019, Dec. 20). Dallas has 200 murders in 2019.  Here’s what that means. The Dallas Morning News.  Accessed at https://www.dallasnews.com/news/crime/2019/12/20/dallas-has-had-200-murders-in-2019-heres-what-that-means/
[ii] Jaramillo, C.  (2019, June 7).  Texas Gov. Gregg Abbott announces he’s sending state troopers to Dallas to tackle violent crime. Dallas Morning News. Accessed at https://www.dallasnews.com/news/2019/06/08/texas-gov-greg-abbott-announces-he-s-sending-state-troopers-to-dallas-to-help-tackle-violent-crime/
[iii]Byrne, E. (2019, June 7).  Gov. Gregg Abbott deploys DPS to combat Dallas violent crime spike. The Texas Tribune. Access at https://www.texastribune.org/2019/06/07/Texas-governor-Greg-Abbott-DPS-Dallas-crime/
[iv]Jaramillo, C.  (2019, June 7). Texas Gov. Gregg Abbott announces he’s sending state troopers to Dallas to help tackle violet crime. The Dallas Morning News, Accessed at https://www.dallasnews.com/news/2019/06/08/texas-gov-greg-abbott-announces-he-s-sending-state-troopers-to-dallas-to-help-tackle-violent-crime/
[v]Perez, G. (2019, August 5). Are state troopers in South Dallas doing more harm than good?  Texas Standard,  Accessed at https://www.texasstandard.org/stories/are-state-troopers-in-south-dallas-doing-more-harm-than-good/
[vi]Jaramilllo, C. (2020, January 3). South Dallas man slain by DPS troopers after traffic stop had 16 gunshot wounds, autopsy shows.  The Dallas Morning News.  Accessed at https://www.dallasnews.com/news/crime/2020/01/04/south-dallas-man-slain-by-dps-troopers-after-traffic-stop-had-16-gunshot-wounds-autopsy-shows/
[vii]Ibid, Garcia N. (2019).
[viii]Crowe, J., Lacy, C., and Columbus, Y. (2019).  Barriers to food security and community stress in an urban food desert. Urban Science. Accessed at  https://www.mdpi.com/2413-8851/2/2/46
[ix]Wise, K. (2019, December 13). Dallas homicides are pretty much everywhere. D Magazine.  Accessed at https://www.dmagazine.com/frontburner/2019/12/dallas-homicides-are-pretty-much-everywhere/
[x]Shinneman, S. (2019, December 18). Explore this updated map of Dallas’ 2019 homicides.  D Magazine, December.  Accessed at https://www.dmagazine.com/frontburner/2019/12/explore-this-updated-map-of-dallas-2019-homicides/
[xi]Kathoff, K. Dallas homicides happening all over the city.  NBC 5 Dallas-Ft. Worth.  Accessed at  https://www.nbcdfw.com/news/local/dallas-homicides-happening-all-over-the-city/2271971/
[xii] Rincon, E.T. and Tiwari, C. (2019).  Construction of a Demand Metric for Supermarket Site Selection: A Case Study of South Dallas. Presentation at Applied Geography Conference, Charlotte NC, October 24, 2019
[xiii]Census Bureau, New Census Bureau estimates show counties in South and West lead nation in population growth. Release No. CB 19-55, Table 3 Top 10 Counties in Percentage Growth: 2017-2018.  Accessed at https://www.census.gov/newsroom/press-releases/2019/estimates-county-metro.html
[xiv]Ibid, Rincon, E.T. and Tiwari, C. (2019). 
[xv]City Council Briefing, NIBRS Crime Briefing, Reported through Tuesday, December 31, 2019.  Accessed at http://www.dallaspolice.net/resources/CrimeReports/NIBRS%20Weekly%20Admin%20Council%20Report%20New.pdf
[xvi]Jaramillo, C. (2020, January 3).  ‘Predictive policing,’ part of Chief Hall’s crime plan, raises concerns.  The Dallas Morning News.  Accessed at https://www.dallasnews.com/news/crime/2020/01/04/predictive-policing-part-of-chief-halls-crime-plan-raises-concerns/

Ethnic Cleansing: Trump’s New Strategy


          If you were under the impression that ethnic cleansing takes place only in other countries with maniacal dictators, perhaps it is time to reflect on the recent behavior of President Trump in regards to recovery efforts in Puerto Rico following Hurricane Maria.  By some accounts, the disaster recovery in Puerto Rico was a clear example of the deliberate and prolonged neglect of a large segment of U.S. citizens.

An estimated 3,000 Puerto Rican residents died as a result of Hurricane Maria – not just from the immediate storm but also from the inadequate recovery efforts that allowed too many victims to suffer from the limited access to clean water, food, transportation and medical attention. The level of human misery in Puerto Rico, which continues to this day, was apparently of little consequence to President Trump who boasted that the recovery effort was one of the most successful in U.S. history.  Making matters worse, President Trump even now rejects the estimate of 3,000 deaths from Hurricane Maria, suggesting that the high death estimate was merely a political ploy by Democrats to “make me look bad.”   

Trump’s suggestion that the 3,000 deaths resulting from Hurricane Maria was a political ploy by Democrats is consistent with other conspiracy theories that point to his detachment from reality, including such things as:

·        Promotion of the birther theory regarding President Obama;
·       The claim that Muslims celebrated 9/11 on rooftops;
·        Suggesting that Ted Cruz’s father was involved in the JFK assassination; and
·        Claiming that 3 to 5 million illegal votes were cast in the 2016 election.

President Trump has made no secret of his disdain for Puerto Rico and its leadership, even delaying the waiver of the Jones Act to expedite the delivery of needed resources. Indeed, his disdain for other non-white and immigrant groups has been shown through statements and policies, including the separation of Latino children from their families;  legal action to end the DACA program;  travel restrictions based on religious beliefs;  and the consistent derogatory statements made in reference to Mexicans,  Haitians, black athletes, and war heroes like the late Senator McCain.  More recently, the Trump administration announced the transfer of $10 million from the FEMA budget to ICE  — an action that further underscores the priority placed on the removal of unwanted groups.  Perhaps it is time to ask: Is President Trump developing a program of ethnic cleansing? 

As defined by a United Nations Commission, ethnic cleansing is defined as follows:   
“….rendering an area ethnically homogeneous by using force or intimidation to remove persons of given groups from the area… a purposeful policy designed by one ethnic or religious group to remove by violent and terror-inspiring means the civilian population of another ethnic or religious group from certain geographic areas. “
Since he became president, Donald Trump has implemented a number of programs that could fall under this definition of ethnic cleansing,  including  arbitrary arrest and detention; confinement in ghetto areas (i.e., families in detention centers); forcible removal;  displacement and deportation (i.e., even asylum seekers);  deliberate attacks or threats of attacks on civilians (i.e., especially protestors at campaign rallies); and robbery of personal property (that is, seizure of personal property from forcibly removed persons). 

Although Trump has yet to implement some of the most coercive practices that have been utilized globally by current and past dictators, following is a listing of the various practices that have been used to achieve the objectives of ethnic cleansing:
  • Murder
  • Torture
  • Extrajudicial executions
  • Rape and sexual assaults
  • Severe physical injury to civilians
  • Use of civilians as human shields
  • Destruction of property
  • Attacks on hospitals, medical personnel and locations with the Red Cross/Red Crescent emblem, among others.

Without intervention by legal advocates and human rights organizations, one wonders how many of these most coercive practices President Trump would implement given the opportunity and growing support by his conservative base.  Yet, the withholding and delay of needed emergency assistance and the resulting 3,000 deaths of Puerto Rican citizens presents tangible evidence that President Trump has added a new dimension to the ethnic cleansing formula. 

Apparently, it is not enough to separate families, deport asylum seekers, place immigrant children in detention centers, and publicly disparage immigrants and non-whites – it now appears acceptable to simply delay or withhold emergency assistance in order to punish or remove unwanted segments of the U.S. population.  To say the least, this is a disturbing development and made equally frightening by the many “pro-life” Republicans who choose to remain silent on this issue.

Takata Recall Campaign: Consumer Safety Threatened by Corporate Greed and Government Missteps

If you are one of the unfortunate owners of a vehicle that has been recalled due to a defective Takata airbag, I feel your pain. Driving a vehicle with an airbag that could explode on impact and kill or injure you or your passengers is unnerving to say the least.  But being forced to drive it without access to a replacement vehicle from the auto dealer where it was purchased clearly puts the nail in the coffin.

The U.S. community is no stranger to product recalls, especially those that pose an immediate danger to public health.  Indeed, we are accustomed to seeing contaminated food products removed from store shelves, factories closed when listeria has contaminated our food supply, persons isolated when they have been diagnosed with a deadly virus like Ebola, and emergency teams deployed to communities impacted by natural disasters.   Responses to such events have one thing in common:  they never rely on just one method of communicating with the public about these dangers, and often include a mix of broadcast media, social media, public bulletins, city-wide sirens, community churches, and other approaches.  Our traditional response has been effective in quickly isolating the danger to the public, thereby saving lives and reducing injuries.

For some curious reason, however, relatively little alarm and urgent action has been associated with the deaths and injuries that have resulted from the recognized failure of Takata airbags – 11 deaths and 180 injuries – a problem that was first reported by Honda about 8 years ago. [1]   Unlike other national public hazards, millions of vehicle drivers are being forced to operate their vehicles with these defective airbags and endangering their lives and family members. Why?  Presumably because there is a shortage of replacement parts. But there is more to this story than just a shortage of parts.

Especially troubling is the anemic airbag completion rate that automakers are showing in response to the national Takata recall campaign. According to a recent National Highway Traffic Administration (NHTSA) press release (12-9-16). [2]   46 million Takata airbags in 29 million U.S. vehicles have been recalled, but only 12.5 million of these airbags, or 27 percent, have been repaired. The ability of Takata to meet the 2019 completion deadline set by NHTSA looks really dim since an additional 64 to 69 million more inflators in 42 million U.S. vehicles are expected to be recalled over the next three years. Scott Upham, CEO of Valient Research, tracks airbag sales and recently stated in an interview that Takata is under tremendous financial strain from the recalls and likely to file bankruptcy unless help is provided by the Japanese government or automakers. [3]

The responsiveness of automakers to the national Takata recall has varied significantly and partially explains why the NTHSA declared recently that automakers were not doing enough to speed up the process. The following table displays the airbag repair completion rates by make of the vehicle as presented in the NHTSA web site.

Takata Airbag Completion Rates by Make of Vehicle, 2016

Make
Total Airbags Repaired
Completion Rate
Honda
8,289,301
50.31
FCA – Chrysler
1,469,233
33.77
Daimler Trucks North America
778
29.91
Toyota
1,478,852
29.52
Nissan
294,752
21.98
Ford
369,457
21.29
Subaru
185,470
19.60
Mitsubishi
19,719
17.30
Ferrari
441
15.58
BMW
246,301
13.23
Mazda
1,192,556
10.64
Daimler Vans USA LLC
1,822
2.33
Mercedes Benz
3,434
0.48
General Motors
671
0.22
 Source: www.nhtsa.gov

NHTSA cautions that these airbag completion rates do not represent the real-time status of recall performance since there are inherent delays in the repair status and the time that the repair is reported to NHTSA. Also, the agency explains that it is difficult to compare completion rates because “some recalls include vehicles that have been under recall for many years, whereas others reflect recalls that have only just started or have only started in a discreet geographic area due to parts restrictions.”  Nonetheless, it is safe to assume that these completion rates are a snapshot of the current challenge facing each automaker.  Honda, for example, had the largest number of recalled airbags but has managed to complete repairs for 50.3 percent of these airbags.  By contrast, automakers with large numbers of defective airbags had completion rates that were considerably lower:  Chrysler (34%), Toyota (30%), and Mazda (11%).  Most of the automakers had completion rates under 30 percent. Regardless of whether these completion rates were influenced by the lack of replacement parts from Takata or not, it is discomforting to hear from NHTSA that automakers may not be making their best efforts to reduce the number of potential deaths and injuries resulting from the defective Takata airbags. [4]

What explains the anemic recall completion rate to a public hazard that has already resulted in 11 deaths and 180 injuries?  In my view, shred responsibility falls on the shoulders of four key participants of the recall campaign:  NHTSA, the automotive industry, the vehicle owners, and Takata.

The NHTSA:  NHTSA has struggled to engage automakers and vehicle owners through its various directives and policy initiatives.  The agency’s standard news coverage about the Takata recall simply “urges” vehicle drivers to check their vehicle identification number on www.safecare.gov and to contact automotive dealers to replace the defective airbags. NHTSA has ordered 19 automakers to recall nearly 42 million cars, making it the largest recall in U.S. automotive history.[5]  The agency required automakers to send two notices to vehicle owners, mostly by mail,[6]   which is not likely to reach about 20 percent of consumers who move on a monthly basis and may not provide a forwarding address. The dismal airbag repair completion rates prompted NHTSA to voice its concern to automakers that they were not doing enough to contact vehicle owners, and “encouraged” them to try other tactics like mass advertising or social media – which are not legally required. [7]   NTHSA’s directives to the automotive industry were hampered by two other realities:  (a) it cannot legally force automakers and dealers to provide rental cars to customers who sometimes have to wait years for a replacement airbag, and (b) auto dealers selling used cars were not legally required to disclose to customers if a defective Takata airbag was present in the vehicle.[8] Curiously, it was not until June 1, 2016 that NHTSA issued a federal directive that required rental car agencies to fix any and all open safety defects before renting out vehicles to customers.[9]   More recently, the NHTSA ordered automakers to submit a “recall engagement plan” within 90 days to substantially improve their outreach to vehicle owners.  NHTSA has also initiated bus tours in high-priority states to improve awareness of the recall campaign among vehicle owners.[10]

Clearly, NHTSA is probably doing the best that it can within its legal constraints to expedite the Takata recall process, but the agency desperately needs more legislative support to force the automotive industry and vehicle drivers to comply with the recall objectives.  To date, NHTSA has received relatively little support from lawmakers to accelerate compliance with the Takata recall campaign. Senator Bill Nelson, a Florida Democrat whose state has experienced several of the deaths and injuries resulting from the failed Takata inflators, shared his frustration with the slow pace of the recalls:

“The top priority must be doing whatever is necessary to get these potentially deadly airbags out of people’s cars as quickly as possible.  If we wait another three or four years for these to get replaced, more people are likely to die.”  [11]

Lastly, NHTSA’s method for establishing priority vehicles for airbag repair is limited in two important ways.  Focusing repairs on vehicles located in hot and high humidity areas, for example, overlooks the many vehicles that will occasionally travel from less warm or low humid areas to hotter or more humid places like Texas.  Secondly, focusing attention on older vehicles makes sense, but what plans are in place to communicate with the many vehicle owners who are more likely to buy used or older vehicles – such as the lower income, the elderly, immigrants, or other vulnerable groups?

The Automotive Industry:  With the possible exception of Honda, some automakers have allowed corporate greed to shape their response to the millions of potential Takata recall victims who were, ironically, responsible for their success.   In some respects, this comes as no surprise since automakers have not always shown good faith towards its customers and have required federal intervention to protect consumers from deaths and injuries.  Four key examples come to mind:

  • Toyota:  As recently as 2014, Toyota was fined $1.2 billion by the U.S. Attorney General for their behavior in hiding safety defects from the public, calling it “shameful” and a “blatant disregard” for the law. A $1.2 billion criminal penalty, the largest for a car manufacturer in the U.S., was imposed by the Attorney General.[12]
  • Volkswagen: Volkswagen recently reached settlements emerging out of lawsuits from car owners and the U.S. Department of Justice after the Environmental Protection Agency said Volkswagen had fitted many of its cars with software to fool emissions tests.   One $1 billion settlement will give at least some owners of the remaining 80,000 diesel vehicles caught in the company’s emissions cheating scandal the option of a buyback and provide all of them with compensation on top of any repurchase or repairs.  The settlement with U.S. regulators and attorneys for owners of the 3-liter diesel cars will include a choice of a buyback for 20,000 vehicles. The company has reached a separate $1.2 billion deal with its U.S. dealers and is still facing potentially billions more in fines and penalties and possible criminal charges.[13] 
  • General Motors:  GM has paid roughly $2 billion in criminal and civil penalties and settlements stemming from a faulty ignition switch linked to 124 deaths and 275 injuries. The switch can slip out of place, causing engines to stall and cutting power to the brake, steering and air bag systems. The defect prompted the recall of 2.6 million vehicles in 2014. The company had previously acknowledged that some of its employees knew about the switch defect for years before a recall was initiated.[14] 
  • CarMax: CarMax Inc. and two other major used auto retailers have agreed to settle Federal Trade Commission charges that they touted how rigorously they inspect their used cars, yet failed to adequately disclose that some of the cars were subject to unrepaired safety recalls. The proposed consent orders will prohibit them from making unqualified inspection or safety-related claims about their used vehicles if any are subject to open, or unrepaired, safety recalls.[15] 
  • Rental Car Companies: Starting June 1, 2016, rental car agencies must fix any and all open safety defects before renting out vehicles to customers, giving the safety agency power to investigate and punish violators for the first time. It seems incredible that rental car companies had no second thoughts about placing their customers in danger until they were forced to comply by a government order.[16]  

Without aggressive government intervention, one can only imagine how many deaths and injuries could have resulted from the uncontrolled agreed of selected members of the automotive industry. This corporate greed and rather callous indifference to consumer safety has apparently re-surfaced in the Takata recall campaign as automakers appear content with doing the minimum required by NHTSA to communicate and support their customers during this crisis. For example, in recent interviews (4-15-16) with representatives of different automakers, a news reporter with the San Francisco Chronicle discovered the following car rental or loaner practices: [17]
  • Most automakers do not offer a loaner vehicle or free rental car to vehicle owners who are required to wait for a replacement airbag – which could take several years.
  • Honda has the most generous car rental policy that it communicates to customers via its web site. Since 2014, Honda has provided 232,000 loaner and rental cars to its customers – no doubt a key factor that has helped Honda achieve an airbag repair completion rate of 50 percent.
  • Mazda also communicates via its web site that customers can request a loader if they have received a recall notice, a program that has resulted in 1,234 free car rentals.
  • By contrast, Toyota, Nissan and BMW do not post information about car rentals on their web sites, but assume a more passive approach by providing a loaner car only if asked by the vehicle owner.
  • Ford and Volkswagen do not offer vehicle owners any alternative transportation.
The extent of this corporate greed is further illustrated in a recent Senate report released in June 2016 by Sen. Mark Nelson (D-Fla.) that tells us even more shocking news:  new cars are still being built with flawed Takata airbags, which will continue until 2018 to “phase out supplying the defective inflators to fulfill existing contracts.”[18]  Worse yet, the newer versions of the airbags that are being installed today are expected to be recalled as well at a later date.  As Sen. Mark Nelson explains it: “What’s troubling here is that consumers are buying new cars not realizing they’re going to be recalled….these cars shouldn’t be sold until they’re fixed.”  Karl Brauer, a senior analyst with Kelley Blue Book added:  “This may be the first time in history where multiple automakers are selling brand new cars with a known, and potentially deadly defect….the scope of this recall continues to expand, and the number of vehicles impacted by it has already reached a level that will take years to resolve.” Automakers, with the permission of the federal government, have apparently decided to place their sales and profits above the safety of their customers.
 In addition, the refusal of automakers to use mass advertising to alert vehicle owners about the Takata recall campaign contradicts their standard industry practices.  Mass advertising – a comprehensive strategy that incorporates television, radio, print, the Internet and social media — is commonly used by automakers to market their vehicles to consumers, comprising millions of dollars in advertising expenditures each year. Although automakers may believe that they are saving advertising dollars by avoiding the use of mass advertising to alert vehicle owners about the recalled Takata airbags, perhaps they may re-consider their decision once the lawyers begin using mass advertising to represent the many disgruntled or injured consumers resulting from the recall.      Really, it would not be that difficult to create a mass advertising campaign where automakers could pool their resources to more quickly alert vehicle owners about the defective Takata airbags.   The U.S. Census Bureau, for example, has demonstrated the power of mass advertising in achieving a high response rate to the decennial census by incorporating a broad multilingual campaign that engaged different segments of the U.S. population.  Such a campaign would be highly beneficial in accelerating compliance with the Takata recall campaign. The mass advertising campaign should also alert new vehicle buyers if their new vehicles will include a Takata airbag, whether it is currently defective or will become defective in the near future.  Consumers have a right to know this information so that they can opt to purchase a different vehicle or perhaps delay their purchase altogether.
The Vehicle Owner:  Are vehicle owners just ignoring the alerts to replace defective Takata airbags?  Do they understand these notices? Or are they just indifferent to the recall campaign?  Of course, one cannot answer these questions conclusively without hard evidence, especially given that no mass advertising has been implemented yet and auto dealers have been given wide latitude by the NHTSA to comply with the recall campaign. However, assuming that vehicle owners remain non-complaint even though (a) they are aware of the Takata recall campaign, (b) are offered a loaner or rental car while waiting for a replacement airbag, and (c) replacement airbags are available, it seems that the federal government should take charge and force consumer compliance as it has done in the past with the use of safety belts and automobile safety inspections. In addition, some states are suspending driving privileges to ensure compliance with government programs like child support.  Consumer compliance, however, may not be the major impediment to the Takata recall program in the context of the weak support and corporate greed demonstrated by the automotive industry, as well as federal notices of encouragement that lack the force of law. 
One mysterious question that emerges about consumer reaction surrounding the Takata recall campaign is:   Where is the public outrage?  Indeed, where are the advocacy groups, such as Mothers Against Drunk Driving (MADD), that have been effective in mobilizing consumers, creating broad media coverage, and shaping legislative changes on important social or health issues?  Is the public just uninformed about the deadly consequences of defective Takata airbags, or has the public been sedated by the various philanthropic activities of automakers?  Corporate giants have long recognized the importance of community investment to insulate their reputations from the wrath of communities that have been impacted by their defective products or controversial policies.  Perhaps some of the corporate donations to communities – such as soccer stadiums or scholarships programs – should be shifted to support a broader mass advertising campaign that alerts vehicle owners about the recall campaign and availability of car rental programs.     
While NHTSA and automakers continue to waltz around the programs and policies that could substantially improve compliance with the Takata recall campaign, consumers will increasingly lose their patience and becoming increasingly fearful of being the next victim of the deadly Takata airbags. Rather than wait for replacement airbags to arrive, vehicle owners may be considering other options, such as:
  • Seeking a legal remedy if automakers refuse to provide a replacement vehicle
  • Stopping car payments until defective airbags are repaired or replaced
  • Starting a collective boycott against non-responsive automakers to obtain a replacement vehicle.
  • Lobby lawmakers to push for legislation to immediately stop automakers from installing defective Takata airbags in new and used vehicles, whether they are currently defective or will become defective in the near future.
  • Require automakers, dealers and rental companies to disclose to all buyers or rental customers whether a vehicle contains a Takata airbag that is currently defective or will become defective in the near future.
While NHTSA encourages vehicle owners to continue driving vehicles while they are waiting for replacement airbags, one attorney – Todd Walburg with Lieff Cabraser Heiman & Bernstein – has a different point of view. Mr. Walburg has sued many car companies on behalf of consumers and advises the owners of recalled vehicles “to stop driving the car immediately. Take it to a dealership and demand a rental car, because the safety of the owner and their families is at risk.  If they don’t provide a rental car, look into legal options.” [19] 
Takata:  What do you tell the company that started the forest fire?  At the very minimum, do not start more fires.  Ironically, Takata continues to manufacture airbags with the same defective inflator design, and U.S. automakers will continue to install these airbags until the year 2018 to allow Takata to fulfill its current contractual agreements. Concern for the deaths and injuries that may occur with this arrangement has taken a backseat to the need to fulfill business contracts with the approval of our federal government.   For unknown reasons, Takata became the favored supplier for automakers and has enjoyed a 30 percent market share of all airbag sales.[20]  While Takata and automakers were enjoying their successful relationship, no one seemed too concerned that the honeymoon could be threatened by a massive recall of Takata airbags.  Honda was the first to issue a recall of Takata inflators in 2008, while it took another five years (2013) for Takata to file a defect report about manufacturing problems with their airbags.  A year later (2014), NHTSA asked several automakers to recall vehicles with Takata airbags in hot and humid regions because of airbag ruptures occurring in Florida and Puerto Rico.[21] 
These milestones may seem reasonable given the complexities associated with the largest recall campaign in U.S. history.  However, a recent blogpost on the web site of Valient Market Research [22] revealed key information suggesting that Takata delays may have had an ulterior motive. As Daniel Gremke, the blogpost writer tells us:
  • Honda and Nissan, the two flagship customers of Takata, refused to financially bailout their longtime safety systems partner;
  • Takata repeatedly failed to accept legal and financial responsibility for the deaths and injuries resulting from ruptured Takata inflators, and instead blamed their car maker customers for failing to properly test the airbag inflators before production approval throughout the 2000-2012 time period;
  • Takata repeatedly manipulated inflator test data prior to submitting it to its OEM customers throughout the mid-2000’s. Despite concerns shared in internal memos by American Takata engineering executives about the Japanese practice of data falsification and manipulation, Takata continued this practice until its discovery several years ago.
  • After a highly respected German technical research firm – Fraunhofer Institute – confirmed the problem with Takata’s chosen propellant for the airbag, Takata publicly admitted that it would change the airbag’s propellant formula after 2018.
Given its obvious efforts to falsify the test data, it is possible that Takata’s foreign ownership shielded them from criminal prosecution by the U.S. Attorney General as occurred when Toyota hid its safety defects in 2014.  Interestingly, the delays associated with Takata’s refusal to accept responsibility for the deaths and injuries that its airbags have caused, coupled with the federal government’s reluctance to act more decisively in stopping the continued use of these airbags, have both given Takata ample time to populate increasingly larger numbers of U.S. vehicles with its defective airbags, thereby ensuring dependency on Takata well into the future. It seems incredible that the NHTSA would allow the continued installation of defective Takata airbags, especially when recognizing the current dismal airbag repair compliance rates by automakers; that is, because large numbers of vehicle owners are not getting their defective airbags replaced, what this business arrangement does is increase the number of time-sensitive land mines that will explode sometime in the future. In addition, many of these older vehicles will escape detection and repair since vehicle sales by individual owners are not being monitored very carefully.  We should all worry about the population of used vehicles, since the average age of vehicles on America’s roads is 11.4 years and expected to grow rapidly as new cars become less affordable.[23] 
Thus, it appears that no one in the automotive has been in a hurry to protect consumers from the defective Takata airbags.  On the contrary, current NHTSA policies and automaker practices appear to favor the continued sales of vehicles with known defective Takata airbags over the short and long-term safety of consumers.  In the meantime, the marketing of vehicles continues as usual while consumers are expected to accept the premise that they should blame a parts shortage for the deaths, injuries, and absence of rental cars that they are likely to experience. Are U.S. consumers so naïve, or will they take decisive action to change the course of the Takata recall campaign?
Suggestions to Facilitate the Takata Recall Campaign
As one of the largest recalls in U.S. history, it is reasonable to expect that the Takata recall campaign will take many years to achieve.  However, the length of time that it takes to achieve 100 percent compliance will require all participants to make aggressive efforts to change their behavior, programs and policies.   The following table summarizes the changes that I believe are needed to accelerate the Takata recall campaign.
PARTICIPANT
RECOMMENDED ACTIONS
Takata
·        Get the financial support needed from Japanese banks to expand capacity to repair all defective air bags
·        Stop using the defective propellant in any airbags, new and replacements
·        Allow third-party experts to monitor all future testing of airbag products to avoid falsification of test data
Automakers and dealers
·        Stop using Takata airbags with defective propellant formula
·        Disclose the use of Takata airbags to all vehicle buyers so they have the option to refuse the purchase of that vehicle
·        Offer rental cars to all vehicle owners waiting for airbag repairs – rentals that do not have any safety defects
·        Create a mass advertising campaign in multiple languages by pooling resources with other automakers to deliver a comprehensive message about the recall campaign
NTHSA
·        Stop Takata immediately from installing any airbags that include the defective propellant
·        Require automakers to provide rental cars to vehicle owners waiting for replacement parts, and publicize this benefit widely
·        Require new/used auto dealers to disclose the presence of Takata airbags to all consumers, regardless of whether the airbags are currently defective or not
·        Require vehicle inspections to include a check on compliance with the Takata recall campaign
Vehicle owners
·        Demand replacement vehicles and consider legal remedies if request is denied
·        Stop buying vehicles that include a Takata airbag with the defective propellant
·        Lobby lawmakers to create legislation with penalties to force Takata, automakers and vehicle owners to comply with the Takata recall campaign
·        Launch a high-visibility protest to expose non-responsive automakers
Inquiries or comments regarding this paper should be sent to Dr. Edward T. Rincon at edward@rinconassoc.com.  To learn more about Rincón & Associates LLC, please visit our web site at https://www.rinconassoc.com. 
ENDNOTES
—————————————–
[1]National Highway Traffic Safety Administration. Fact Sheet: Takata Recall History and Key Terms. https://www.nhtsa.gov/sites/nhtsa.dot.gov/files/documents/120916-fact_sheet-takata_recall_history_and_key_terms-tagged.pdf
[2]U.S. Department of Transportation. “U.S. DOT accelerates replacements of Takata air bag inflators.” Press release of December 9, 2016.  https://www.nhtsa.gov/press-releases/us-dot-accelerates-replacements-takata-air-bag-inflators
[3]Davis, Todd. “Who’s NOT on the list? Up to 40M more cars added to Takata air bag inflator recall.” Dallas Morning News, May 4, 2016.  http://www.dallasnews.com/business/autos/2016/05/04/who-s-not-on-the-list-up-to-40m-more-cars-added-to-takata-air-bag-inflator-recall
[4]Wire Services. “Takata air bag recall will end up affecting over 42 million vehicles.” Dallas Morning News, December 19, 2016. http://www.dallasnews.com/business/autos/2016/12/09/takata-air-bag-recall-will-end-affecting-42-million-vehicles
[5]Davis, Todd.  “Who’s NOT on the list? Up to 40M more cars added to Takata air bag inflator recall.”
[6]Pender, Kathleen. “Takata recall: Some drivers get free rental cars, for months.” San Francisco Chronicle, April 15, 2016.  www.sfchronicle.com/business/networth/article/Takata-recall-Some-drivers-get-free-rental-cars-7252027.php.
[7] Wire Services. “Takata air bag recall will end up affecting over 42 million vehicles.”
[8]Pender, Kathleen. “Takata recall: Some drivers get free rental cars, for months.”
[9]National Highway Traffic Safety Administration. “Effective Today: New Federal law for recalled rental cars protects consumers from vehicle safety defects.” Press release dated June 1, 2016.  https://www.nhtsa.gov/press-releases/effective-today-new-federal-law-recalled-rental-cars-protects-consumers-vehicle
[10] Wire Services. “Takata air bag recall will end up affecting over 42 million vehicles.”
[11]Davis, Todd.  “Who’s NOT on the list? Up to 40M more cars added to Takata air bag inflator recall.”
[12]Vlasic, Bill and Apuzzo, Matt.  “Toyota Is Fined $1.2 Billion for Concealing Safety Defects.”  New York Times, March 19, 2014.  https://www.nytimes.com/2014/03/20/business/toyota-reaches-1-2-billion-settlement-in-criminal-inquiry.html?_r=0
[13]Thanawala, Sudhin, Associated Press. “Volkswagen’s $1 billion deal on diesel cars gives buyback option for owners.” Dallas Morning News, December 20, 2016.  http://www.dallasnews.com/business/autos/2016/12/20/volkswagens-1-billion-deal-diesel-cars-gives-buyback-option-owners
[14]Reuters. “General Motors Settles Ignition-Switch Cases  GM case.”  September 6, 2016. http://fortune.com/2016/09/05/general-motors-settles-ignition-switch-cases/
[15]Dorman, Frank. “CarMax and two other dealers settle FTC charges that they touted inspections while failing to disclose some of the cars were subject to unrepaired safety recalls.”  Federal Trade Commission press release dated December 16, 2016.  https://www.ftc.gov/news-events/press-releases/2016/12/carmax-two-other-dealers-settle-ftc-charges-they-touted
[16]National Highway Traffic Safety Administration. “Effective Today: New Federal law for recalled rental cars protects consumers from vehicle safety defects.”
[17]Pender, Kathleen. “Takata recall: Some drivers get free rental cars, for months.”
[18]Isodore, Chris. “New cars being built with flawed Takata airbags.”  June 1, 2016.     http://money.cnn.com/2016/06/01/news/companies/takata-airbag-recall-new-cars/
[19]Pender, “Takata recall: Some drivers get free rental cars, for months.”
[20]O’Donnell, Paul. “Are you affected?  What you should know about the record-setting Takata air bag recall.” Dallas Morning News, May 6, 2016.  http://www.dallasnews.com/business/business/2016/05/06/what-you-need-to-know-about-the-takata-air-bag-recall-the-largest-in-automotive-history
[21]National Highway Traffic Safety Administration. Fact Sheet: Takata Recall History and Key Terms.
[22]Gremke, Daniel. “Takata’s Future: Implosion, Bail Out or Metamorphosis.” January 7, 2016.  http://valientmarketresearch.com/uncategorized/takatas-future-implosion-bail-out-or-metamorphosis/
[23] Valdes-Dapena. “Average U.S. car is 11.4 years old, a record high.”  http://money.cnn.com/2013/08/06/autos/age-of-cars/

Texas Rangers Stadium: Questionable Polling Practices in a High-Stakes Competition
You have got to be kidding.  On November 8, City of Arlington residents are expected to vote on a divisive ballot measure to finance the proposed $1 billion Texas Rangers Stadium. Meanwhile, campaign stakeholders have released a series of poorly designed, automated, low-cost polls to measure the public opinion on this important issue. What’s wrong with this picture?
With such high stakes consequences, one would assume that poll sponsors would want to support their campaign advocacy with a high-quality poll conducted by a polling company with a recognized track record. Poll sponsors may try to stack the deck to support their campaign objectives, but a reputable pollster with a good track record would not knowingly bias a study. Not everyone that conducts opinion polls, however, are reputable pollsters.  Indeed, the “shadow” polling industry includes many telemarketing firms, call centers and political operatives that have little or no training in survey practices or ethical conduct, and usually not active in professional polling organizations.
Each of the sponsored polls have reported different results, used varying methodologies, and were conducted by polling firms with varying reputations.  Only one of these polls –conducted by DHC Data — has been subjected to critical review by survey experts in local news stories and considered to be of questionable quality.  Interestingly, the polls sponsored by the Say Yes campaign and WFAA/Fort Worth Star-Telegram have not been critically analyzed by survey experts in local news reports. Because the results of these polls are likely to influence the voting behavior of Arlington city residents, I believe that each of these polls require some scrutiny as well. The reputation of a pollster is clearly important, but not as important as their polling methodology in a particular study.
I reviewed only one online report for the poll sponsored by WFAA and the Fort. Worth Star-Telegram, while relying on published news reports regarding the methodology of the other three polls. I discovered shortcomings in all polls, and would like to share my thoughts on their implications for polling accuracy and voting outcomes. My only objective here is to educate the public about good and bad polling practices — topics that I usually address in classes that I teach on survey research methods, mass communications research, and statistics. In addition, the information discussed should provide some help in deciding which poll deserves more of the public’s confidence.
1.      Sample Selection: Each of the polls reported that their target audience included likely voters in the City of Arlington. However, only one of the pollsters — Public Opinion Strategies — sampled landline and cell phone households since they used live interviewers to manually dial the numbers, as required by the FCC, which is likely to capture a more representative sample of voters.  DHC Data (for Save Our Stadium), however, relied exclusively on landline phones while Survey USA (for WFAA/Star-Telegram) relied primarily (76%) on landline phones and less on mobile phones. Good survey practice suggests that pollsters should rely less on landline telephones because their penetration has declined significantly in recent years and are more likely to capture older residents. A recent study by the Pew Research Centers explains the wisdom of placing more reliance on cellphone households in telephone-based surveys:
“Samples of adults reached via cellphone are much more demographically representative of the U.S. than samples of adults reached via landline. Consequently, replacing landline interviews with cellphone interviews reduces the degree to which survey data need to be weighted to be representative of U.S. adults. This in turn improves the precision of estimates by reducing the margin of sampling error. Perhaps not surprisingly, one major survey was recently redesigned to feature 100% cellphone interviewing.”  (The Twilight of Landline Interviewing,” Pew Research Center, August 1, 2016)
Thus, studies that rely primarily on landline telephone households may be “stacking the deck” by placing more weight on the opinions of older residents than the opinions of residents that depend more on cell phones, such as younger and ethnic minority residents.
2.      Exclusion of Demographics:  Without demographic information about the poll respondents, it is difficult to know how well the poll respondents represented the voting community. There is no good reason to hide this information other than to avoid scrutiny by other experts. Each of the studies tell us that their target audiences were likely voters in the City of Arlington, but only one of the polls (WFAA/Star-Telegram) provided demographic information for the respondents that could influence the survey outcomes – such as race, gender, and age.  For pollsters that do not disclose demographic information, we are left to wonder if these polls over- or under-represented particular segments of the community which could mispresent the polling results. None of the pollsters reported whether their polling results were weighted or adjusted to reflect the demographics of the voting community in the city of Arlington.
3.      Questionnaire Content:  Survey experts interviewed in news stories had mixed opinions about the one poll reviewed (Save Our Stadium), pointing to such problems as leading questions or long questions that would test the memory of any person. Campaign representatives on both sides have pointed to incomplete or misleading descriptions of the ballot measure as well.
4.      Data Collection Approach:  With the exception of Public Opinion Strategies (POS), the two other polling firms (DHC Data and Survey USA) opted to use the cheapest and least credible data collection approaches to collect opinions on this divisive issue: pre-recorded, automated telephone calls instead of live telephone interviews.  Automatic telephone calls have little credibility in the polling industry because they remove human contact, and do not provide any opportunity for clarification when respondents are confused. Automated telephone calls are often rejected by residents because they are associated with telemarketing firms that often annoy the public. Polling firms employ automated calls when they have limited time available, have a limited budget to fund live telephone interviews, or have limited resources to use live interviewers. Because FCC regulations prohibit automated calls to cell phone users unless they are manually dialed, polls using automated methods exclude nearly half of community residents who have only wireless devices but no landline telephones – a practice that systemically excludes younger residents and ethnic minority groups.

5.      Language offered:  Based solely on news reports about these polls, it appears that none of the pollsters offered a language other than English to collect their data. Why is this important?  Hispanics comprise 29 percent of Arlington city residents, while 36 percent of Hispanics are foreign-born and primarily Spanish-speaking.  Our past experience shows that 50 to 63 percent of Hispanics will prefer a Spanish-language interview because they find it easier to express their opinions. Unless their presence in the voting community is minimal, it makes little sense to exclude this strong base of baseball fans by offering only one language. Indeed, it is likely that the estimate of support for the new stadium could be under-estimated by this exclusion.
6.      Pollster’s Reputation:  The reputation of the polling companies was also discussed in news reports.  In my opinion, Public Opinion Strategies utilized the most credible polling methodology since all interviews were conducted by telephone with live interviewers, their two polls included landline and cell phone households, and the company has a long history of public opinion polling.  DHC Data, however, was characterized in news reports as having a low visibility, no web site, and questionable experience as a pollster. Its owner, however, claims to have conducted several polling studies in past years.  Survey USA – who conducted the WFAA/Ft. Worth Star Telegram poll, was also described as having a solid polling history. Interestingly, survey experts only scrutinized the poll conducted by DHC Data, while the polls conducted by the other two polling firms received praise for their track records but little criticism of the polling techniques used in the Texas Rangers campaign.  It is a risky practice to avoid scrutiny of a pollster’s practices because they have a great reputation.
In summary, the most recent polling results are summarized below:
·        Save Our Stadium poll by DHC Data:  38% support, 46% oppose, 16% undecided
·        Say Yes polls by Public Opinion Strategies:
o   Sept. 23-25:  54% support, 40% oppose, 6% undecided
o   Oct. 14-15:  56% support, 37% oppose, 7% undecided
·        WFAA/Ft. Worth Star Telegram poll by SurveyUSA: 42% support, 42 opposed, 16% undecided
Ultimately, the election scheduled for Nov. 8  will be the final word on which pollster provided the best picture of how Arlington residents feel about the Texas Rangers Stadium issue.  Based on the information evaluated thus far, I believe that the polling results by Public Opinion Strategies for the Vote Yes campaign – 54-56 percent supporting the stadium referendum – presents the most accurate picture of the actual voting outcome.  Why?  Primarily because they used human beings to conduct the interviews and included both landline and cell phone residents in their study. The poll was not without its own shortcomings since it did not describe the respondents’ demographic attributes, and may have excluded Spanish-speaking and younger voters by over-relying on landline telephone households.  Nonetheless, I believe that their polling practices and results are more deserving of the public’s confidence in comparison to the other polls. 
Thus, poll sponsors that invest minimally in opinion polls and approve of practices that are known to bias polling results do a disservice to the voting community.  Since the results of these polls are likely to positively or negatively influence the actual voting outcomes, it is imperative that pollsters utilize recognized best practices in polling and also disclose demographic information about the respondents in their polls that can be used to evaluate potential sources of bias stemming from their sampling or data collection methods.
Journalistic Blind Spots
It is one of the least understood paradoxes of contemporary times: As our nation is experiencing the most dramatic demographic transformation in history, Americans are becoming less familiar with members of their diverse communities.  Part of the explanation for this trend, sociologists tell us, is that our nation’s schools, churches, residential communities and social groups are becoming more racially segregated.  This may not come as a surprise since people generally spend more time with others that share something in common, including  race or ethnicity, economic standing, religious or political beliefs, or  general lifestyles.   What is perhaps less understood, however, is the extent to which our nation’s journalists and media contribute to this increasing segregation of our communities. For various reasons, I believe that the role of media segregation deserves our collective attention.
Journalistic blind spots are common practices by media professionals that portray communities of color through a distorted lens – as unfavorable, less visible or perhaps insignificant – practices that reinforce stereotypes and continued segregation amidst continued growth and diversity. Following are a few observations from my past years in evaluating mass media that illustrate my concerns. While these observations are based primarily on media trends in Texas and the Dallas/Fort Worth metropolitan area, it is likely that geographic areas throughout the U.S. have had similar experiences. 
·       Anointing of Ethnic Leaders: Have you ever wondered why journalists often use the terms “Black leader” or “Latino leader” in news stories, but are careful to avoid the use of the term “white leader”?  Whether deserved or not, the practice tends to elevate the importance of the opinions expressed by these “leaders,” which may or may not represent their communities. Journalists are hard-pressed to explain this practice.
·       Biased Political Coverage:  News sources are not always objective in their coverage of political candidates. In a recent mayoral election, for example, a Latino candidate’s electability was an ongoing topic of local news stories, describing the candidate as having “no chance of winning” against the incumbent white candidate. The curious placement of a story about the Latino candidate next to the obituary section of the newspaper reinforced the news bias even further.  And in yet another political story discussing Latino support for Donald Trump in Texas, the reporter chose to discuss the only poll that showed the highest support for candidate Trump, while acknowledging the substandard quality of this poll’s methodology and overlooking more credible polls that placed Latino support for Trump at a much lower level. Whether intentional or not, these practices inject unnecessary bias in news stories that describe the Latino political campaigns and voter sentiments.
·       The Usual Suspects: The sentiments of people of color, especially local ones, are often invisible in news stories or op-ed sections. It is not for a lack of opinions or an absence of experts since there are many people of color that are able to articulate their points of view on a variety of topics. Instead, journalists often take the path of least resistance and utilize the “usual suspects” – that is, the same academics, business or civic members – which discourages a diversity of ideas. To further influence public sentiment on a controversial issue, the editorial staff of news organizations will offer their own point of view. For example, recent local news coverage about the possible loss of ABA accreditation for the UNT Dallas School of Law has been largely negative, while ignoring local community sentiments that are supportive of the law school. Communities of color, in particular, are in dire need of a more affordable legal education and more Black and Latino attorneys to serve their needs. The law school needs more, not less, advocacy on this issue.  The practice of selecting the “usual suspects” may be convenient but does not contribute to a diversity of ideas – something that can be remedied by expanding the pool of the usual suspects.
·       Predictable News Coverage: Past studies of mass media content coverage show that the majority of news coverage about Latinos has been concentrated in just four areas:  crime, immigration, poverty, and under-achievement. Similarly, news coverage of African Americans is often saturated with stories about racial profiling and police relations, criminal investigations of high profile politicians and celebrities, and school-related problems. With this constant diet of negative news stories about Blacks and Latinos, is it any wonder that residential communities are becoming more racially segregated?  These negative portrayals have impacted the decisions by supermarket chains and other businesses to serve these communities, which are perceived as having little economic potential – leading the Dallas City Council to offer a $1 million incentive to encourage business development in these communities. Such negative news stories, however, often tell an incomplete story about communities of color.
·       The Curious Absence of Commerce: It is a rare day indeed that journalists will cover a topic that relates to the business or economic vitality of communities of color – almost as if it does not exit.  This should not be so difficult in a metro area where minority-owned businesses contribute significantly to the area’s economy. In the most recent Survey of Business Owners, the Census Bureau tells us that in the Dallas/Ft. Worth metro area, there were 80,994 Black, 117,592 Hispanic and 52,456 Asian business owners with 2012 sales of $37 billion. In addition, the aggregate household income (or crude measure of buying power) for Black, Latino and Asian consumers totals to $63.3 billion – or 31 percent of the metro’s total buying power of $204 billion. Despite the large presence of minority-owned businesses and surveys that document the consumer behavior and buying power of multicultural consumers, business journalists seem to find it more rewarding to cover ethnic celebrations, food, and occasional problems at ethnic chambers of commerce. Clearly, there is significant room for improvement in the business section of news media.
·       Segregated media: The failure of mainstream media to address the information needs of diverse communities has fueled the growth of ethnic media, which often provides more relevant content to its audiences. However, this trend has further segregated our communities as mainstream journalists and media become increasingly comfortable with the notion that ethnic media are best suited to handle news about ethnic communities. Segregated media, unfortunately, further decreases the likelihood that community residents will become familiar with the lifestyles and achievements of other members of their communities, especially in areas like economics, civic and political participation, educational attainment, technology, scientific innovations, and religion.

Of course, the media industry is only one of many factors that contribute to the increasing segregation of our communities. Nonetheless, journalists and media executives need to be held accountable for the role that their media products play in creating and reinforcing the negative stereotypes and unbalanced portrayals of communities of color.  Hiring more Black and Latino journalists, while important, is not sufficient as long as the final word on news content remains in the hands of media executives who are indifferent to these blind spots.  We will know when we have achieved some measure of success when mainstream media, in particular, begins to include more balanced news content about communities of color, expands the diversity of views by local opinion writers or experts, and utilizes more credible opinion polls of our communities. By eliminating these blind spots, media executives will likely expand the diversity of ideas in news reports, include more balanced portrayals of communities of color, and perhaps become more relevant to their diverse news audiences.
UNT Dallas School of Law: A Work in Progress

It was disturbing to learn that the UNT Dallas School of Law is in danger of not receiving accreditation from the American Bar Association. This is not just bad news for the school, but also for the many students who have studied there expecting to finish their legal education from an accredited law school. The ABA committee cited several reasons for their decision

  • Too many students are being admitted that are struggling in school and being placed in academic probation, being dismissed or simply dropping out
  • No study has been conducted to assess the validity of the holistic admissions process used by the school, which considers a range of factors like LSAT scores, undergraduate GPA and courses taken, work experience, and various other life experiences.
  • Financial projections based on the potential demand for educating part-time students were not supported by any marketing study to assess demand for part-time education. 

The picture that emerges is that UNT was taking risks in their admissions decisions and not conducting the needed research to evaluate the effectiveness of their holistic admissions model.  On the positive side, the ABA committee was impressed with the school’s quality of teaching, student engagement, its library and technology resources, and the substantial opportunities for students to participate in pro-bono legal services.
There are many other reasons, however, to suggest that the law school is worthy of more praise and recognition for its bold initiative to provide an affordable legal education for under-represented groups. First and foremost, we should not overlook the fact that UNT Dallas College of Law is the only public law school in North Texas, and its tuition of $15,133 is the lowest of any law school in Texas.  In today’s job market, many law school graduates are finding it difficult to obtain a job that allows them to pay the student loans that they acquired to finance their legal education. An affordable legal education makes a lot of sense these days, and the UNT Dallas College of Law is among the few law schools that appear committed to addressing this barrier to a legal education for under-represented groups.
Secondly, Texas requires that only graduates of accredited law schools can take the bar exam.  On the face of it, this makes sense although various states do not have this requirement and give this responsibility to the state’s bar association — including California, Georgia, Alabama, Connecticut, Massachusetts, West Virginia and Tennessee.  Passing the bar exam from a non-ABA accredited law school may not be the ideal career decision, but may be a viable choice for the many students that are locked out of ABA-accredited law schools due to sky-rocketing tuition fees and rigid entrance requirements. It would seem that passing the bar exam should be the ultimate rite of passage for entering the legal profession, but it is not. UNT Dallas College of Law aspires to become an ABA-accredited law school so that its graduates will be able to take the bar exam; however, this may not happen under current Texas law.   The school has apparently sacrificed its ability to become ABA accredited by deliberately accepting students with lower LSAT scores and undergraduate GPAs, and providing them a chance to become an attorney. Should the school be punished for this or rewarded?
As part of the group of psychologists that specialize in the design and evaluation of educational measurement tests, I have often written about the shortcomings of college admissions tests like the SAT or LSAT, as well as state competency tests, in determining the educational choices for racial-ethnic groups.  Such tests are but one measure of an individual’s likely academic performance, but often fall short in their ability to predict the academic performance of African Americans, Latinos and women.  More importantly, the LSAT tells us little about an individual’s success as a lawyer.

Thirdly, there is little justification in my opinion for maintaining a legal education system where the majority of its graduates are white.  Using data from the most recent demographic report by the American Bar Association, the chart on the left shows that 84 percent of attorneys in Dallas County are white, although they represent just 27 percent of the County’s population.  By contrast, 43 percent of Dallas County’s population is Latino, while only 4.9 percent of all attorneys are Latino. Similarly, African Americans represent 22.3 percent of the Dallas County population, while they represent just 5.3 percent of Dallas County attorneys


In more practical terms, these disparities mean that:
  • There is one white attorney for every 52 whites in Dallas County
  • There is one African American attorney for every 634 African Americans in Dallas County
  • There is one Latino attorney for every 1,441  Latino residents in Dallas County, and
  • There is one other race-ethnic attorney for every 235 other race-ethnic residents in Dallas County.

Of course, we should not assume that white attorneys only serve whites, that African American attorneys only serve African Americans, or that Latino attorneys only serve Latinos – but that is often the case in the legal profession. What is truly surprising is that too many law schools have become complacent with these disparities and appear unwilling to change their models of legal education to improve access to under-represented groups like African Americans and Latinos.

Thus, to the extent that the race-ethnicity of Dallas County attorneys matters in the delivery of legal services, it seems clear that non-white residents of Dallas County are significantly under-served. But does the race-ethnicity of attorneys really matter? Yes it does. In one recent study of Latino legal needs in Dallas County, we learned that two-thirds of Latinos desired an attorney that spoke Spanish or had staff that communicated in Spanish. This finding is not particularly new as it is commonly known that trust, empathy and rapport are essential skills in medicine, psychology and other professions where communicative skills are important.
An additional reality is that the majority of attorneys in Dallas County that serve Latino legal needs have traditionally focused their practice on issues related to immigration, personal injury, DWI or criminal cases.  Few attorneys target Latinos with legal services designed to protect their assets, such as wills and estate planning, bankruptcies or home foreclosures, intellectual property, and business contracts.   In the long run, this imbalance in the availability of legal services and attorneys makes communities of color more vulnerable to the many adverse actions that impact their quality of life.  
I genuinely believe that the UNT Dallas College of Law is an admirable and innovative concept with the potential to radically change the composition of the legal profession. The ABA committee should allow the school’s third-year students to take the bar exam as a final validation that they were able to master this important rite of passage into the legal profession – despite their academic and personal struggles.  Anyone that has been through an advanced education knows that it is alwaysa struggle to balance your personal life with the academic challenges in pursuing a professional education
.    
In addressing the issue of failure, Zig Zigler cautioned us to “remember that failure is an event, not a person.”  Struggling, failing and perseverance have been the formula for success of many of today’s leaders. Ironically, the review by the ABA committee focused on the struggles that the UNT Dallas College of Law is experiencing in fulfilling its mission, and in the same action is eliminating the only potential evidence that the school’s model is working by not allowing the school’s first cohort of graduates to take the bar exam.  Perhaps Michael Jordan best described the often forgotten link between failure and success:

“I’ve missed more than 9,000 shots in my career.  I’ve lost almost 300 games.  Twenty-six times I’ve been trusted to take the game winning shot and missed.  I’ve failed over and over and over again in my life.  And that is why I succeed.”

We should not fear the possibility that many of these students may actually pass the bar exam.  In the movie Stand and Deliver, Jaime Escalante proved to the College Board and many other skeptics that low-income Latino high school students have the capacity to excel in calculus given the right teaching approach and motivation.  Perhaps our nation’s law schools should take their cue from Mr. Escalante and Michael Jordan, and dare to innovate.
Latino Voter Turnout: Time to Re-fresh Our Thinking
National news headlines this past weekend announced Tim Kaine as Hillary Clinton’s choice for Vice President.  Given the nation’s anticipation of this announcement, It was interesting to see that the major headline of news reports was focused on Tim Kaine’s fluency in Spanish, which he aptly demonstrated to Miami audiences.  
This is not the first time that we have seen a political candidate speak Spanish to win the hearts of Latino voters.  President George W. Bush, for example, used his limited Spanish-speaking skills to engage Latinos in his gubernatorial and presidential elections. When Spanish-speaking skills were lacking,  some politicians have chosen to showcase their Latino family members in their campaigns — including wives, grandmothers and nephews.  The assumption, of course, is that Latinos will somehow connect culturally with the political candidate, translating into more votes.  Donald Trump, however, gets the top award for Most Disconnected Political Candidate for his recent tweet showing him eating a taco bowl and saying “I love Hispanics.”  
Tim Kaine, however, is not the typical politician that is reaching out to Latino voters.  Aside from his good Spanish-speaking skills, he seems to have more insight into the Latino culture  — using humor, personal anecdotes, and underscoring values that are important to Latinos.  In addition, Tim Kaine’s past career included litigating civil rights cases, missionary work in Honduras, and other social involvement in communities.  His political career has been impressive with a track record for winning all of his past competitions for elective office.   Indeed, Tim Kaine appears to be an excellent addition to the Clinton team with considerable potential for engaging Latino voters.
Given the lower voter turnout rates of Latinos in past presidential elections, however, Democrats risk the possibility of losing this election if they continue to rely on the same strategies of past elections to engage the Latino voter. The selection of Tim Kaine is just one element of Clinton’s Latino strategy, and not necessarily the most important one.  Hillary Clinton currently has an impressive advantage over Donald Trump as shown by recent polls of Latino registered voters at the national, statewide, and metro levels (see Table 1 below).  Indeed, Hillary Clinton’s advantage over Donald Trump ranges from 39 to 58 points.

                                                   Table 1
                  Candidate Margins in Recent Latino Voter Polls
Poll
Hillary Clinton
Donald Trump
Margin
Fox News May 2016 U.S.
62%
23%
39%
Pew Research June 2016 U.S.
66%
24%
42%
Rincon & Associates June 2016 Dallas/Ft. Worth  Metro
50%
11%
39%
Univision Poll July 2016 U.S.
67%
19%
48%
Latino Decisions July 2016 Texas
74%
16%
58%

But some of these polls also show that about one-quarter of Latino registered voters remain undecided about the candidates, may vote for another candidate, or just stay home on election day.   Coupled with the daily changes in the political campaigns  – convention activities, disclosure of DNC emails, endorsements – Democrats cannot afford to get too complacent.

Interestingly, as national polls of the general electorate show Hillary Clinton’s edge over Donald Trump diminishing, the role of the Latino vote will take center stage, especially in the battleground states. There is certainly no shortage of eligible Latino voters as current Census Bureau reports tell us that at least 26 million Latinos will be eligible to vote in the November 2016 election.  Table 2 below shows that 80 percent of these eligible voters were located in just 10 states.  The problem, however, is that only 48 percent of eligible Latino voters actually cast a vote in the 2012 presidential election. Which begs the question:  What magic wand is going to move the Latino voter turnout rate beyond 48 percent? Surely, it would be risky to simply rely on the same campaign strategies of the past.

                                          Table 2
            Estimate of U.S. Latinos Eligible to Vote
                        in November 2016 Election
State
Latinos Eligible to Vote
California
6,907,428
Texas
4,820,430
Florida
2,566,940
New York
1,870,750
Arizona
985,387
Illinois
931,744
New Jersey
824,210
New Mexico
596,169
Colorado
550,775
Pennsylvania
430,592
Total Eligible
20,484,425
   Source: American Community Survey One-Year Estimates, 2014


The Message to Latinos

The challenge of engaging the millions of eligible Latinos to become registered voters has already received a jump-start from Donald Trump. Judging by reports from California and Georgia, registration of Latino voters is surging as a direct result of the negative campaigning that Donald Trump has directed in past months towards Latinos, immigrants, women, war heroes and the disabled. But more effort will be needed to move the needle beyond the 48 percent turnout rate.  This hardcore segment of Latino non-voters will need a strong message that will remind them about the consequences to families if they decide to sit out the November election. This message or messages will need to be educational and persuasive since non-voters are less likely to know or understand the policies that differentiate the presidential candidates and the consequences to their quality of life.  
Past political campaigns have used several slogans to engage Latinos, such as “Si se puede,” “Su voz es su voto,” and “Juntos se puede.”  Perhaps it is time to go beyond these traditional slogans and engage the talents of advertising agencies to create new slogans that excite Latinos about the importance of participating in the upcoming presidential election.   The new strategy, however, will need to incorporate both an educational component and a persuasive call-to-action component.
Following are some ideas for the educational component of a new non-voter campaign:  
·        Support for a Path to Citizenship: The lives of 12 million undocumented immigrants remain on hold due to the lack of progress on immigration reform. The Clinton-Kaine team supports a path to citizenship for these immigrants, many of whom include women and children that escaped persecution in their countries of origin.
·        Minimum Wage of $15 per hour:  Many workers on minimum wage will benefit by this increase in the minimum wage, especially Latinos who often work for low wages in restaurants, hotels, and construction.  The Clinton/Kaine team supports a $15 per hour minimum wage.
·        Voter ID Laws:  Republicans have tried their best to limit the voting power of Latinos and other groups by pushing voter ID laws with little evidence of voter fraud. Democrats, on the other hand, have been fighting successfully in the courts to eliminate such laws.
·        Supreme Court Appointments: The next president will have the opportunity to appoint one or two Supreme Court justices, which could radically change the laws that influence the quality of life of many Americans. Latinos cannot afford to allow Donald Trump to take this opportunity to appoint justices that will eliminate programs or policies that benefit Latino families.
·        Support for Women’s Rights:  A woman’s right to choose her options for family planning continues to be threatened by Republicans, especially in states like Texas.  Such efforts especially impact lower-income Latinas who often require support and guidance in choosing the right family planning options, and obtain needed exams for breast cancer screening.
·        Support for Free Tuition at Public Colleges:  More Latinos are graduating from public colleges but start their careers with large student debt.  The Clinton/Kaine team is making free tuition at public colleges a top priority of their campaign, but no support by the Trump campaign has been offered in this area.
·        Support for Gun Control:   The absence of tougher background checks has made it too easy for people with bad intentions to purchase weapons that can kill large numbers of people in a few minutes. These weapons threaten the lives of all Americans, especially groups who are often the target of hate crimes such as Latinos, immigrants, African Americans, gay/lesbians, and police officers. Despite the many deaths in the U.S. that have resulted from the use of these weapons, Donald Trump has no plans to change gun control laws. The Clinton/Kaine team will support tougher background checks and limit the sale and distribution of these military-style weapons.
·        Expanding Healthcare for the Uninsured:  Historically, the uninsured rate for Latinos has been among the highest in the U.S.  The Affordable Care Act, known also as Obamacare, has greatly improved access to health insurance for Latinos and other groups who have had difficulty in obtaining affordable healthcare coverage.  The Clinton/Kaine team plans to keep and improve The Affordable Care Act, while the Trump candidate promises to eliminate it.
Creative ideas regarding the persuasive call-to-action component are best handled by talented advertising agencies that develop multiple ideas for slogans that are tested with the target audiences.  “Feel the Bern” is an excellent example of a slogan that resonated well throughout this presidential campaign with many audiences, and there is no reason why similar slogans cannot be created for Hillary Clinton that resonate well with English and Spanish-speaking audiences.
Delivery of the Message

Past efforts to engage and educate Latinos about the importance of their civic participation have included voter registration drives, use of traditional media (i.e., television, radio, newspapers), appearances at community events, endorsements by key Latino leaders or personalities, and sending relevant information to parents by coordinating with schools.  However, a digital revolution is taking place among U.S. Latinos that dramatically expands the ability of political campaigns to engage Latinos. As reported recently by the Pew Research Center,  U.S. Latinos now have nearly comparable access to the Internet compared to whites, and rely greatly on mobile devices to engage with the news, shopping, and communicating with family members.  Following are some suggested steps for enhancing the delivery of these messages to the un-engaged Latino electorate:
·        Focus on the geographic areas where Latino eligible voters are highly concentrated. The American Community Survey provides detailed information regarding the geographic areas that include sizable numbers of Latino eligible voters – at the state, metro, county and city levels.
·        Tim Kaine should continue to communicate in Spanish throughout the campaign since it is useful as one way to establish rapport among Latinos. Not all political candidates, however, have the cultural experience that Kaine has to make the Spanish pitch sound credible.  But remember that the majority of Latino voters are native-born and communicate primarily in English. Both English and Spanish-language messages and media vehicles should be utilized to ensure a balanced delivery of the campaign messages.
·        Maximize the use of social media, a popular form of communication for Latinos.  Latinos are more likely than non-Latinos to access the Internet, use apps, and Facebook through their mobile devices, and often share their information will their networks of friends and family members.  Apps are low in cost compared to traditional media, and have the potential to reach   all segments of Latinos through a mix of attention-grabbing technology.
·        Engage the support of the many businesses and organizations that employ significant numbers of Latinos to provide their employees time off on election day to cast their vote, encourage early voting to avoid long lines on election day, and sponsor transportation to facilitate travel to voting precincts when needed.  Too many blue collar or low-wage workers have restricted work schedules that have contributed to a lower voter turnout.
·        Latino bloggers, radio and television personalities should be more aggressively engaged to discuss the myths and hysteria that the Trump campaign has been promoting. The Clinton campaign, for example, has sponsored some relevant television commercials that focus on the impact that Trump’s insulting statements are likely to have on the nation’s children.  Similar tactics should incorporate Latino adult audiences and the potential impact on their quality of life.

It would be premature to think that these thoughts provide the silver bullet that is needed to ensure that the Latino voter turnout rate surpasses 48 percent in the November presidential election.  However, it is perhaps time to expand our collective thinking about innovative strategies to engage Latinos in the November election this year.

Political leaders often embrace positive satisfaction ratings, but should they?
It should come as no surprise that political leaders enjoy quoting the positive ratings from surveys of the communities that they serve – a sort of badge of honor for their job performance.  Ex-Dallas City Manager A.C. Gonzales is no exception, making reference to a recent citizen satisfaction survey of 1,512 Dallas City residents that showed an overall community that, with some exceptions, appeared quite happy with City services.  Mayor Mike Rawlings has also referenced these positive ratings from these surveys as well. At the national level, Republican nominee Donald Trump recently pointed to positive student satisfaction ratings to counter allegations of fraud in lawsuits against Trump University.  Indeed, positive ratings are like candy to politicians, whether deserved or not.
But how much faith can we place in these satisfaction ratings? In a recent column by Dallas Morning News columnist Robert Wilonsky, he noted the apparent paradox of the City’s continuing high ratings given the multitude of problems that are left unresolved, such as potholes, loose dogs mauling citizens in poor neighborhoods, contracting irregularities, deteriorating air quality, traffic congestion, and a host of other issues.  Wilonsky also pointed out that the survey vendor’s report curiously omitted information about the ages represented by the study respondents.  Indeed, the report tells us nothing about the satisfaction levels across racial-ethnic groups, income groups, age groups or other key demographics – information that would provide more insight on how well the study sample mirrored Dallas’ diverse population. The City of Dallas is now 41 percent Latino, 24 percent black, 3 percent Asian, and 29 percent white – a diverse community of residents that are entitled to have their voices heard in surveys sponsored by their tax dollars.
While City leaders have no problem embracing citizen satisfaction ratings, we should be cautious about embracing the results of satisfaction surveys, especially those that consistently show their sponsors in a positive light. In the case of the City of Dallas, there is reason to believe that these satisfaction ratings could be inflated and a self-serving exercise for City leaders:
  • Past community surveys for the City have shown a pattern of under-representing certain racial-ethnic groups, age groups, non-English speakers, and the lower income  – groups who are more likely to have negative experiences and opinions of City services. Loose dogs and potholes, for example, are more common in poor neighborhoods.  To what extent would the positive ratings diminish if the voices of such residents were properly represented in the survey?
  • Of course, the survey vendor’s quality of work may be spectacular, making it easier to eliminate the competition. However, the most recent City satisfaction report omitted standard demographic information about the 1,512 city residents that completed the survey.  One has no idea if the survey respondents accurately reflected the diversity of this community by race, ethnicity, gender or age. This is information that is considered standard in industry research reports — information that is commonly used to judge the scientific credibility of the survey findings. Why have City staff allowed the omission of this important information from its report?
  • Given the positive ratings that the City continues to enjoy from these surveys, it is not surprising that the survey company that conducts these surveys has enjoyed a preferred vendor status for many years. While the survey contract is bid competitively, the same out-of-state vendor has been successful in obtaining the contract year after year even though there are various local vendors that are equally qualified to conduct the work.  Are City leaders and staff concerned that a different vendor would change the positive ratings that they enjoy?  
          Community satisfaction ratings provide one measure of the City’s performance in serving a community, but provide an incomplete picture of its actual performance since key groups are often omitted or under-represented in such studies. The fascination of City leaders with these positive ratings and comparisons to other U.S. cities creates the false impression that everything in Dallas is just peachy.  A guided tour of City neighborhoods tells quite a different story.

Clearly, the next City Manager for Dallas, as well as the next Mayor, will have a long list of City-related needs that will require their immediate attention. If the results of citizen satisfaction surveys continue to be used by City leaders and staff as a benchmark of their annual or periodic performance, some changes will be needed to inspire more confidence in the ratings provided by this survey.  First, it is absolutely essential that the public is provided access to a detailed methodology that describes the steps used to conduct the study, including the extent of support in languages other than English.  This is important because many studies confirm that over half of Latino and Asian adults prefer to communicate in their native language, a fact that improves comprehension and survey participation.  Second, the report must provide a detailed demographic profile of the survey respondents – a standard requirement in all research industry studies – and perhaps the only evidence that the random selection of City households resulted in a fair and unbiased representation of the City’s diverse community.  Lastly, to remove the appearance of favoritism in the vendor selection process, City staff should be required to justify the continued selection of one vendor over several years despite the availability of various equally qualified survey vendors.
Latino Leadership Development in Dallas: Some Room for Optimism
Much to their credit, Dallas-area academic, business and civic members have embarked upon an ambitious effort to expand the number of Latino leaders that serve this community. Two of these programs reside at Southern Methodist University with similar goals in mind. Part of the rationale for these programs comes from national studies by the Pew Research Center (2013) which showed that two-thirds of Latinos did not know, when asked, who they believed was the most important Hispanic leader in the U.S.; moreover, three-quarters of Latinos believed that a national Hispanic leader was needed to advance the concerns of the U.S. Hispanic community. This national alarm bell, coupled with dismal Latino participation at the local levels, appeared to describe a leadership vacuum in the Latino community that needed some type of intervention.
Latinos, of course, are not leaderless. U.S. Latinos have a long history as inventors, scientists, medical experts, military heroes, news columnists, entertainers, and politicians — they are just not very visible because mainstream media sources choose to overlook their achievements except during cultural holidays.  If the story does not involve crime, immigration, under-achievement or poverty, the likelihood of inclusion in mainstream media diminishes even more rapidly.  
For example, anyone who has lived in the Dallas community for a number of years would have little difficulty in recognizing Latinos that have been on the frontlines of many Latino-related issues. Such names as Adelfa Callejo, Hector Flores, Nina Vaca, Rene Martinez, Domingo Garcia, Marcos Ronquillo, Rafael Anchia, Roberto Alonzo, Tom Lazo, Beatrice Martinez, and Edwin Flores are well-known among Dallas-area Latinos and non-Latinos for their past advocacy efforts related to Latino education, healthcare, immigration, voting rights, business development and other areas.  Media reports may label Latinos as “leaders,” “advocates,” or “activists” – depending on the spin desired by media decision makers. Nonetheless, their role in shaping the quality of life for Latinos is undeniable.
As the traditional pool of “leaders” or “advocates” diminishes, it is clear that new blood is needed to address the many decisions that will influence the quality of life for Latinos in the future. The need for new blood is especially important in communities like Dallas/Fort Worth that are experiencing rapid population growth and need decision-makers with new ideas to address the challenges brought by this growth. In this light, Latino leadership programs have assumed a great responsibility and deserve as much support as possible.   
To that end, following are some questions or discussion points that came to mind as I was envisioning the types of skills that these graduates may need to carry the leadership torch into the future:
What knowledge will these graduates have of Latinos that reside in the U.S. and local communities?  For example, a test of knowledge of Latino culture in the U.S. was recently completed by a non-random sample of 400 Latinos and non-Latinos that represented college students and marketing professionals from the private sector.  The test results revealed that both Latinos and non-Latinos had limited knowledge regarding some basic facts about U.S. Latinos. Interestingly, the results also revealed that Latinos did not score much better than non-Latinos on this test. While not a scientific study, the study results suggest that more effort should be devoted towards expanding knowledge about the Latino population – whether at academic institutions or other training vehicles. Moreover, as Latinos continue to assimilate linguistically and culturally, they may also need a refresher course on important elements of the Latino culture.
What position will graduates take on issues that especially impact Latinos?  The position that a leadership graduate takes on key issues like gun control, abortion, criminal justice, voting rights, racial profiling, the environment, public procurement, and immigration will likely define their appeal in Latino and non-Latino communities. Are graduates being trained to avoid a position on controversial issues or will they be taught how to argue persuasively on behalf of Latino constituents?
Are your public speaking skills ready to be tested?  General public speaking skills are undoubtedly a valued asset; however, Latino leaders will be expected on occasion to address both English and Spanish-speaking audiences.  Since the vast majority of U.S. Latinos do not study Spanish formally, it might be a good idea to encourage our future leaders to brush up on their public speaking skills in both languages.
Will graduates be trained to feel comfortable in using the results of research studies?  In one presentation to a city council regarding the results of a citizen satisfaction survey, a councilman opined:  “If I want to know what people in my community think, I will just talk to them.”  Apparently, the councilman did not understand the bias associated with his recommendation in gathering public opinion. Scientific research can provide valuable insights that supplement one’s perspectives and should be part of the training curriculum for these graduates.
Will non-Latinos be provided the opportunity to develop their leadership skills if their jobs or political aspirations include Latino communities?   It seems like a good investment.  There are already enough non-Latinos in leadership positions that lack knowledge and experience with Latino communities. With our increasingly segregated society, the leadership course may provide the right amount of knowledge and perspective needed by non-Latinos who aspire to become advocates for Latino communities.
Will graduates understand how to utilize the power of the media which has the potential to define their reputation and standing in the minds of Latino and non-Latino audiences?  Markets like Dallas/Fort Worth provide a multitude of communications vehicles to reach diverse audiences, and often conduct public opinion polls to monitor key issues or political campaigns. In such an environment, Latinos who aspire to become visible advocates or “leaders” must understand how to fashion their messages correctly, how the journalism world operates, and the audiences that are served by different communications vehicles.
Lastly, will the collective wisdom of past Latino leaders be used as a bridge to the future for the newly trained leaders? It would be a mistake, in my opinion, to believe that “leadership skills” have little or no connection to the past. Past Latino leaders could be helpful in identifying significant people, organizations or historical events that have proved helpful in past Latino initiatives, as well as those that have been less helpful. The new leadership graduates will no doubt have many new ideas of their own, but history should help them avoid repeating the mistakes of the past.
Only time will tell us about the long-term benefits of these Latino leadership initiatives.  If they are successful, Latinos will be in a better position to shape their own destiny and become a more visible partner in key decisions that affect their quality of life.
Donald Trump: The New Chicken Little

As the story goes, an object fell from the sky and hit Chicken Little on the head, prompting Chicken Little to panic and create hysteria throughout his town to warn others that the sky was falling. The sky was not falling, of course, but considerable chaos followed before the truth was discovered.

Like Chicken Little, Donald Trump would have everyone believe that the sky is falling – that is, that uncontrolled immigration and border security is threatening America. To protect America from certain doom, Trump is proposing to build a wall that would keep all immigrants out, deport the 12 million undocumented persons in the U.S., and deport citizens that were born to undocumented parents.  Our Chicken Little has succeeded so far in creating considerable hysteria regarding immigration policy as well as support for his proposed remedies. As the following charts illustrate, however, the hysteria is based on a fantasy that contradicts two key facts about immigration trends in the U.S.

Fact 1:  China, not Mexico, is sending the most immigrants to the U.S.

A special report issued by the U.S. Census Bureau analyzed immigration levels for the period 2000 to 2013, shown below, which illustrated some interesting trends.  First, the level of immigrants to the U.S. from Mexico declined significantly from 400,000 to 125,000 during this period.  Secondly, in 2013 there were more immigrants to the U.S. from China (147,000) and India (129,000) than Mexico (125,000).  Clearly, immigration from Mexico has been declining over the years and does not merit the hysteria that is commonly associated with it.

 “China Replaces Mexico as the Top Sending Country for Immigrants to the
United States,” Research Matters, U.S. Census Bureau, May 1, 2015 
Fact 2:  Border apprehensions of Mexicans have fallen dramatically over the past 14 years, and were higher in 2014 for non-Mexicans. 
In their current report on border apprehensions, the Pew Research Center analyzed U.S. border apprehensions since the year 1970 and revealed yet more evidence that “the sky is not falling.” Apprehensions of Mexicans peaked in the year 2000 with an estimated 1.6 million apprehensions, which declined dramatically to 809,000 in 2007 and 229,000 in 2014.  Interestingly, border apprehensions in 2014 for non-Mexicans (257,000) are exceeding Mexican apprehensions. Are border walls and deportations planned for non-Mexicans as well?
“U.S. border apprehensions of Mexicans fall to historic lows,” Jens Manuel Krogstad
and Jeffrey S. Passel, Pew Research Center, December 30, 2014.   
Ratings of the political candidates show that Trump and his supporters are either unaware, uninterested or indifferent to these facts.  News anchors have explained Trump’s popularity “angry voters” who are tired of establishment politicians and an admiration for Trump’s no-holds barred approach.  In my own view, Trump is the Pied Piper of our times who has managed to persuade a substantial segment of likely voters to suspend reality by embracing a fantasy that simply does not exist.  Trump would have us forget that Mexican immigrants:
  • Are frequently the caregivers for the children of middle to higher-income families;
  • Are concentrated in the construction industry that builds our nation’s infrastructure;
  • Have defended the U.S. in past wars through active participation in our armed forces;
  • Have kept our Social Security system solvent because they are not qualified to benefit from the millions of dollars that they contribute annually;
  • Are taking the jobs that most Americans do not want but are nevertheless important to our economy, such as agriculture, construction, restaurants and hotels. 
It is indeed difficult to imagine that Americans would be willing to abandon their mutually beneficial relationship with Mexican immigrants, especially when recognizing that the sky is really not falling when it comes to immigration trends.  Perhaps it is time for the political candidates to start talking about some real problems, like the economy, healthcare, and education. If they must talk about border security, perhaps they should begin a conversation about the other border or ports of entry into the U.S.

Is your multicultural research misleading marketing decisions?

Despite the dramatic growth of multicultural populations in the U.S., many survey companies continue to use outdated assumptions and practices in the design and execution of surveys in communities that are linguistically and culturally diverse. Following are some of the more problematic practices that may warrant your attention, whether you are a survey practitioner or a buyer of survey research.

1. Is your survey team culturally sterile?
If your survey team lacks experience conducting surveys in diverse communities, you may  already be dead on arrival. Since most college courses on survey or marketing research do not address the problems that are likely to occur in culturally-diverse communities, mistakes are very likely to happen.  An experienced multicultural survey team member is needed to assess the study challenges and resources. Really, how else will you know if something goes wrong?
2.  Are you planning to outsource to foreign companies?
So your firm has decided to outsource its Latino or Asian surveys instead of hiring your own bilingual interviewers. Think twice about this.  If you have ever monitored interviews conducted by foreign survey shops, you are likely to discover several issues that impact survey quality: language articulation problems, and a lack of familiarity with U.S. brands, institutions, and geography.  The money that you save by outsourcing will not fix the data quality issues that will emerge from these studies. Better to use an experienced, U.S. based research firm with multilingual capabilities that does not outsource to foreign survey shops.
3. Are you forcing one mode of data collection on survey respondents?
Think about it —  mail surveys require reading and writing ability; phone surveys require one to speak clearly; and online surveys require reading ability and Internet access. Forcing one mode of data collection can exclude important segments of consumers that can bias your survey results. Increasingly, survey organizations are using mixed-mode methods (i.e., combination of mail, phone and online) to remove these recognized limitations, and achieving improved demographic representation and better quality data.
4. English-only surveys make little sense in a multicultural America.
Of course, everyone in America should be able to communicate in English, and most do. But our own experience confirms that two-thirds of Latino adults and 7 in 10 Asians prefer a non-English interview when given a choice. The reason is simple: Latino and Asian adults have large numbers of immigrants who understand their native language better than English – which translates to enhanced comprehension of survey questions,, more valid responses, and improved response rates.  Without bilingual support, the quality of survey data is increasingly suspect in today’s diverse communities.
5. Are you still screening respondents with outdated race-ethnic labels?
Multicultural persons dislike surveys that use outdated or offensive race-ethnic labels that are used to classify them – which can result in the immediate termination of the interview, misclassification of survey respondents, or missing data. Published research by the Pew Research Center and our own experience suggests that it is better to use multiple rather than single labels in a question: that is, “Do you consider yourself Black or African American, Hispanic or Latino, Asian or Asian American, white or Anglo American?” Since Latinos and Asians identify more strongly with their country of origin, it is a good idea to record their country of origin or provide a listing of the countries represented by the terms Latino or Asian.  Use of the label Caucasian is often used along with the white label, but should be avoided because the Caucasian category also includes Latinos.
6.  Are your survey respondents consistently skewed towards women?
A common problem is that multicultural males are considerably more reluctant than white males to participate in surveys, which often results in survey data that is overly influenced by female sentiments and behaviors. The imbalance often results from the poor management of interviewers who dedicate less effort to getting males to cooperate. Rather than improve data collection practices that create such imbalances, survey analysts will typically apply post-stratification weights to correct the imbalance even when large imbalances are found – a practice that can distort the survey results.  It is always a good practice to review both un-weighted and weighted survey data to judge the extent of this problem.
7.  Online panels are not the solution for locally-focused multicultural studies.
With high anxiety running throughout the survey industry from the recent FCC settlement of $12 million with the Gallup Organization, many survey companies will likely replace their telephone studies with online panels.  For nationally-focused surveys, online panels may be an adequate solution to reach a cross section of multicultural online consumers. For local markets, however, the number of multicultural panel members is often insufficient to complete a survey with a minimum sample of 400 respondents. Worse yet, the majority of multicultural panel members are the more acculturated, English-speaking, higher income individuals – immigrants are minimal on such panels. Online panel companies will have to do a better job of expanding their participants with multicultural consumers. In the meantime, don’t get your hopes too high.
8.  Translators are definitely not the last word on survey questionnaires.
So your questionnaire has just been translated by a certified translator, and you are confident that you are ready to begin the study of multicultural consumers. After a number of interviews, however, you learn that the survey respondents are having difficulty understanding some of the native language vocabulary being used, and interviewers are having to “translate-on-the-fly” by substituting more familiar wording – a major problem in multicultural studies. It is obvious that the survey team placed undue confidence on the work of the certified translator, and did not conduct a pilot study of the translated questionnaire to check for its comprehension and relevance among the target respondents.  A good pilot study can save you time, money and headaches.
These tips represent only a partial listing of the many ways in which a survey can misrepresent multicultural communities.  Industry recognition of these types of problems is a first step towards their elimination, although survey practitioners are slow to change their preferred ways of collecting data. Raising the standards for multicultural research will perhaps pick up steam once higher education institutions require the study of these issues in their research courses, and buyers of research require higher standards from research vendors.

You can reach Dr. Rincón at edward@rinconassoc.com

© Rincón & Associates LLC 2015

Some Simple Truths About Language Usage Among U.S. Latinos
Give me a break  — 55 million Latinos in the U.S. and confusion still lingers about the best language to use when communicating with Latinos?  Corporate America continues to pour millions of dollars into Spanish-language media, documents, and campaigns despite the fact that Latinos are becoming increasingly more English-dominant, and audiences for Spanish-language television, radio and print have been losing audiences for some time. Apparently, few marketers have come to grips with the demographic reality that two-thirds of U.S. Latinos are native-born and depend primarily on English-language communications.

This paradox has lingered for two main reasons.  First, too many self-serving marketers and media shops have sold the Spanish language as the single gateway to the Latino community in the U.S., reinforced by a history of biased, self-serving research studies.  Secondly, our nation’s academic institutions continue to produce graduates with little knowledge about the language and other characteristics of U.S. Latinos. In short, the collective Latino IQ of Corporate America is embarrassingly low and unable to distinguish fact from fantasy.

To clear up some of this confusion, I would like to share some simple truths about language usage gleaned from my 36 years of practical experience in conducting surveys and experiments with Latinos for a broad spectrum of private, public and academic clients. I am not a linguistics expert, but have studied the use of language in these studies. This experience has been reinforced by teaching undergraduate and graduate courses on Hispanic marketing, survey research, statistics, and mass communications.  Thus, these simple truths are not just subjective impressions about language usage, but grounded in academic and real-world experiences.
1. Not all Latinos communicate in Spanish.
We have heard and read about it for many years – Latinos have better recall of advertisements in Spanish, Latinos make love in Spanish, the love affair with Spanish telenovelas, and so on.  As a result, marketers continue to pour millions of advertising dollars into Spanish-language media and communications believing that they are reaching all segments of Latinos. However, substantial research evidence confirms the following two facts:
·       Spanish-language audiences are comprised primarily of recent immigrants who are generally less educated, have lower incomes, are the least connected to the Internet, and primarily apartment dwellers.
·       By contrast, native-born Latinos are more dependent on English-language communications,  and generally include children, voters, higher income earners, homeowners, the more highly educated and Internet connected, and professionals.

Although many marketers may prefer to bury their heads in the sand and remain loyal to their Spanish-language strategies, the organizations that are paying for advertising and media placements should be informed that their Spanish-language advertisements may not be reaching a sizeable segment of Latino consumers.
2. Do you understand what I am saying?
It is often the case that a Latino customer is presented a form to complete a transaction or register for a program or service.  Attorneys, healthcare providers, and mortgage companies often present documents that need signatures on documents that involve important decisions. In such circumstances, Latinos are typically asked if they understand what is being explained or what they are reading, and a head nod or “yes” response is usually accepted as confirmation that the information was “understood.”  But is this type of confirmation a valid one?   Perhaps not in some cases,  because there is no follow-up evidence that the information was really understood.  Latinos, especially immigrants, will often confirm that they understand an instruction or a document to save face and not admit that they lack the ability to read or understand that language. Consequently, it is important to ask a Latino customer to explain or demonstrate their comprehension of an instruction by asking them to repeat in their own words what the instruction means, or asking them to physically demonstrate their comprehension. In a healthcare setting, for example, it would be advisable to ask a Latino to repeat, in their own words, the instructions for taking their medication(s)  – clearly a more valid measure of comprehension than a simple head nod.
3. Translators are not the last word on language decisions.
Over the past years, I have used translators for a variety of tasks and languages, and appreciate the function that they serve. With few exceptions, I always use a certified translator with experience in the subject matter at hand, whether legal, healthcare, insurance, etc. – which helps to affirm the accuracy of the translation. However, it is a mistake to think that your job is done when a translator submits their finished product.  In addition to the accuracy of the translated document, it is equally important to know who the intended audience will be and their ability to read and understand the document.  Translators do not always know who the intended audience is, and sometimes produce documents whose reading difficulty level is too high, or include words or phrases that are unfamiliar to the intended audience. By copy testing or pilot testing the translated document, one can have the added assurance that the appropriate communication has been established with the Latino consumer.    
Hence, your customer, not the translator, should have the last word on the acceptability of translated documents.

4. The use of Spanish is decreasing, not increasing.
Although media stories often talk about the large numbers of Latinos that watch Spanish-language television, the media hype contradicts what has been known by demographers for the past decade. That is, the number of Latino immigrants in the U.S. – the primary audience for Spanish-language media – has been decreasing in recent years. As explained by the Pew Research Center, the demand for Spanish-language communications of all types is expected to decrease in the coming years, while the demand for English-language communications will increase as the children of the immigrants comprise a larger component of future population growth.  Of course, this does not mean that an organization should not offer or eliminate Spanish-language support; on the contrary, it underscores the importance of also including English-language communications when reaching out to Latino consumers.
5. Speaking Spanish is not an automatic qualifier for reading or writing in Spanish.
Naïve marketers are often surprised to observe that Latinos can be conversing in Spanish quite comfortably, but may have difficulty when asked to read or write in Spanish. What some marketers fail to understand is that a language usually has at four basic functions or components —  reading, speaking, writing, and listening —  and proficiency in one of these functions does not necessarily mean proficiency in the other functions. In addition, many immigrants from Mexico lack formal education and cannot read or write in Spanish, while other immigrants from Latin America tend to be more highly educated and literate.  By better understanding the origins and educational background of Latinos, marketers can develop communications that will be understood by Latinos in their target audience. Thus, one should always consider the language function being utilized when evaluating a translated document.
6. While the U.S. Census Bureau collects language data, it can be misleading.
Organizations often quote language statistics collected by the Census Bureau as evidence about the number of Spanish-speaking households that reside in the U.S. at any point in time.  The quality of this language data, however, is limited in several ways.  First, one question in the American Community Survey (2015) asks:  “Does this person speak a language other than English at home?” If the question is answered “yes,” then the next question that follows is:  “What is this language?  Thus, we learn from these two questions the number of persons that speak Spanish and other languages as well.  But it does not ask how well Spanish is spoken, or the extent to which that person uses Spanish in any given task.  Presumably, if a person utters one word in Spanish, then they are considered a “Spanish speaker.”

The only other language question included is:  “How well does this person speak English?” – to which one is provided four options:  “Very well,” “Well,” “Not well,” and “Not at all.”  While this type of language proficiency question is useful in providing some guidance on how well a person speaks the English language, other research that I have summarized elsewhere shows that Latinos tend to over-estimate their language skills on self-reported measures like the one used by the Census Bureau – a consequence of social desirability.  That is, native-born Latinos who are more English-language proficient often want others to think that they speak Spanish better than they actually do.  Immigrants, who are more Spanish-language proficient, often want others to think that they speak English better than they actually do.  Even when they claim proficiency in both languages, 9 in 10 native-born Latinos will choose an English-language interview when given a choice, while 9 in 10 immigrants will choose a Spanish-language interview.  Hence, the language that a Latino chooses when provided a choice is a more valid indicator of their language dominance than their self-reported language proficiency.  Our experience suggests that Latinos should always be provided the choice of English or Spanish when asked to complete a task – such as an interview or a written document. This simple procedure will usually assure that you will get a more valid response.  These Census Bureau language questions, while useful, are crude measures of language behavior that should be used cautiously when evaluating the language behavior of U.S. Latinos. Click on this link to read the white paper entitled “Are Latinos Over-Estimating Their Language Abilities with Self-Reported Measures?”  https://www.rinconassoc.com/category/publications  
7. Employers take great risks when using Latino employees for translations or language advice. 

As a shortcut, some companies will utilize Latino employees to translate documents or interpret on the spot when the situation demands it.  Unless you know the training and education of that employee, you are taking unnecessary risks in assigning them this responsibility. Latinos that are born in the U.S. rarely study Spanish formally in school and rely on the Spanish that they have heard or used growing up in their communities – often a mixture of English and Spanish.  Important documents that relate to employee personnel procedures, healthcare, safety, insurance or legal matters should only be translated by a certified translator and copy-tested to ensure that employees understand the translated documents or other visual aids.  Experience also suggests that graphic symbols, such as those used in hazard warning signs, also have cultural components that may not communicate the same message to culturally-diverse groups. Copy testing is especially important with signage that relies on graphic symbols since they are often used to warn or prevent injuries or accidents. 
8. Knowing a language does not necessarily mean that you know the culture. 
In the employment world, many occupations require proficiency in one or several languages.  While proficiency in a language other than English is a definite asset in many jobs, it should not be confused with knowledge of a particular culture.  It is not uncommon, for example, for a foreign-born Latino with an excellent command of the Spanish language to receive more consideration for a job than a similarly educated Latino whose Spanish proficiency is not as well polished —  the assumption being that a higher language proficiency also means more knowledge of the culture.  This assumption may not necessarily be a valid one since a native-born Latino may indeed have more knowledge of the U.S. Latino culture than a foreign-born Latino who happens to communicate well in Spanish. If the job  involves responsibilities with U.S. Latino consumers, then knowledge of the Latino culture in the U.S. should be just as important in employment decisions as proficiency in a language.
9.  Are Latinos really diverse?
I often hear statements about the wide diversity in Latino communities, a reference to the numerous countries of origin represented throughout the U.S.   Indeed, the U.S. Census Bureau tells us that about 22 countries are represented in the category known as Hispanic or Latino.  A look at the Latino population in some geographic areas, however, would lead one to re-think the use of the word “diversity.”  For example, the State of Texas included  10.1 million Latinos in 2013, representing a broad variety of Spanish-speaking countries.  However, fully 88 percent of Texas Latinos were of Mexican origin – not exactly the picture of diversity. Decisions regarding language usage should consider the primary countries of origin represented by the Latinos living in a particular community since the type of Spanish utilized can vary by country of origin.  How can you find out about the country of origin for a particular community?  It’s easy – just visit the Census Bureau Factfinder web site at http://factfinder.census.gov/faces/nav/jsf/pages/index.xhtmlto obtain the Latino country of origin for any city, county, metropolitan area or state.

10.  Language ability depends on sight and sound as well.

My experience in conducting hundreds of focus groups with Latinos has shown that their ability to understand a written document or verbal instruction is sometimes influenced by limitations related to their visual acuity and hearing impairments.  Latinos will not readily admit when they are unable to see very clearly, but an astute observer will notice non-verbal cues that suggest a vision problem.  Similarly, hearing impairments can be subtle and not usually something that will be readily apparent.  As a moderator, I have addressed such issues by reading a document out loud so that everyone can hear and understand the instruction, and ensure that any written documents are provided in large fonts to enhance their readability. Rather than embarrass a person because they cannot see or hear very well, it makes more sense to offer options that will allow all persons to participate in the task or activity. 
Latinos and the Dallas Legal Community: A Case of Two-Way Myopia
Like Mr. Magoo, our legal community sometimes has difficulty seeing beyond their most immediate surroundings. A good example is the large presence of Latinos in the Dallas area, who generally capture the attention of attorneys when they have a problem that is related to traffic accidents, personal injury, immigration or crime – a form of myopia that seems to show little change. This practice is compounded by the myopia of Latinos who often lack knowledge of our legal system and how it can benefit them in other areas as well. This two-way myopia is not a permanent problem, but has a remedy once some of the underlying issues are understood.  This disconnect has the potential of creating a community of Latinos that are becoming increasingly vulnerable to events that threaten their most valued assets. To get the conversation going, I would like to share a few insights about Latinos based on the research that I have conducted in past years and hopefully shed some light on this growing problem. 

 Some Things That We Know About Latinos 

The increasing presence of Latinos in the U.S. has not escaped the attention of the legal industry. In its recent report entitled Latinos in the United States: Overcoming Legal Obstacles, Engaging in Civic Life, the American Bar Association’s Commission on Hispanic Legal Rights and Responsibilities provided a comprehensive review and discussion of the various issues that U.S. Latinos experience in eight distinct areas:  employment, housing, education, healthcare, criminal justice, media and Latino images, and diversity in the legal profession.  The report provides its readers with an excellent foundation for understanding the many challenges that impact the quality of life for Latinos and some possible remedies (www.ambar.org/chlrr).  Our focus on Latinos in Dallas County, Texas provides a detailed look at how Latinos in one community manage  some of these challenges and the extent to which their legal needs are fulfilled by the current legal community in Dallas County.

Latinos are both numerous and unique. According to the Texas State Data Center, Dallas County Latinos currently represent 4 in 10 residents, and are projected to grow to 6 in 10 residents within 30 years. Many organizations are discovering the Latino presence in schools, churches, business, supermarkets, sports, the courts, and other areas, and realizing that Latinos are also unique in various ways.

For example, it has not gone unnoticed to some attorneys that Latinos are concentrated in blue collar jobs that result in more personal injuries and deaths than their non-Latino counterparts. About 6 in 10 Latinos are foreign-born, meaning that they are very likely to need advice on immigration matters as well as Spanish-language support. The recent surge of children entering the U.S. from unstable Latin countries illustrated the demands made on legal professionals who can communicate in Spanish. And their high rate of Latino business formation, about three times higher than the general population, points to the need for advice on business matters as well.

Unfortunately, their generally lower income and education means that Latinos often lack familiarity with the legal system and how it can benefit their families and businesses. Yet others will consult a “notario” – a person that is not licensed or trained to give legal advice but provides it nonetheless for a fee.  The Latino situation is indeed dire and results in their heightened vulnerability to the many problems which families and business owners are likely to encounter on a daily basis. 

Some attorneys have become reluctant to address the needs of Latinos, who are perceived as likely pro bono clients and presenting more challenges to serve properly.   Census data, however, tells us that Latinos are not exactly without economic means. In 2013, for example, Latino households in Dallas County earned an aggregate income (i.e., gross measure of buying power) of $12 billion – representing 19 percent of the area’s total aggregate income of $65 billion. The Survey of Business Owners in 2007 identified 35,056 Hispanic-owned firms that reported sales and receipts of $5.6 billion. In addition, much of the recent migration from Mexico and other Latin American countries includes highly educated business owners that need legal services for commerce. Think about it:  if Latinos were that poor, how is it that many national retailers – airlines, supermarkets, food and beverages, automotive – continue to earn millions in profits from the spending habits of Latino consumers?  While the media may portray Latinos largely as under-achievers and steeped in poverty, they contribute substantially to the economic growth of many U.S. communities. Let’s turn our attention now to some interesting facts about the Dallas legal community.

Some Things That We Know About Our Legal Community 
There are three aspects of the legal community that, in my opinion, have direct relevance to helping us understand the disconnect between Latinos and the legal community.  These three aspects include trust in the legal industry, the traditional practices of area attorneys, and the role of law schools and other community educators.   

In their annual Trust in Advertising Report conducted in 58 countries, The Nielsen Company concluded that the most trustworthy source was earned advertising (i.e., word-of-mouth from friends and family) (84%); second in trustworthiness were branded web sites (69%); and ranked third were consumer opinions posted online (68%).  The study of trust in the legal industry has not been commonplace, although one key study of Texas residents (sponsored by the State Bar of Texas, Texas Supreme Court and Texas Court of Criminal Appeals, 1998) revealed that lawyers were rated the lowest in terms of their honesty and ethics. Based on ratings of  “very” or “somewhat” honest or ethical,  the rating was lower for lawyers (40%), while higher ratings were given to teachers (85%), doctors (77%) and judges (71%). Most lawyers, however, were perceived as being very competent in their profession (77%). These public perceptions may or may not have changed since the study was conducted; however, they underscore the challenge that lawyers face in developing trust with the clients that they serve. 

The manner in which the legal community is composed also deserves some attention in our discussion. A recent New York Times article (Law Schools’ Applications Fall as Costs Rise and Jobs Are Cut, 1-30-13) reminds us that the future availability of lawyers is diminishing as a result of steep increases in the cost of a legal education and an employment market that saddles many law school graduates with high debt – a trend that will impact the availability of Latino attorneys. For example, a Latino looking in Dallas County for a Latino attorney is likely to be frustrated with the available choices. Of the 14,607 attorneys registered in Dallas County during 2011-2012, the State Bar of Texas tells us that only 627 were Latino attorneys while 13,980 were non-Latino attorneys.  This translates to 1 non-Latino attorney for every 108 non-Latino residents, but only one Latino attorney for every 1,543 Latino residents. This disparity is a clear signal that Latinos searching for a Latino attorney may need to consider other options to address their legal needs.

Adding to the problem is the narrow focus of attorneys that serve Latinos. Based on my own observations of attorney advertisements (TV, billboards, newspapers, etc.), Dallas-area attorneys that focus their services on Latinos generally practice in four areas:  immigration, crime, personal injury, and traffic accidents. Often ignored, however, is legal representation that would help Latinos protect their most important assets in the areas of intellectual property (patents, copyrights, trademarks); business contracts; business formation; wills; foreclosures; and bankruptcies. Some attorneys may assume that Latinos have less need for these services; however, I would argue that quite the opposite is true. For example, Latinos have a history of inventiveness that requires the need for intellectual property attorneys to protect their inventions from predators in the marketplace. The U.S. Patent and Trademark Office (USTPO.gov) identifies the many inventions by Latinos that contributed to the social and economic well-being of our nation. These Latinos were fortunate to acquire the legal support needed to protect their important inventions; however, there are potentially many Latinos with innovative ideas that will suffer economically due to the many predators that benefit from intellectual property theft. Indeed, The National Crime Prevention Council estimated that intellectual property thefts cost the American economy more than $250 billion and 750,000 jobs per year. Clearly, Latinos are in dire need of IP attorneys that can protect their innovations.

The recent mortgage crisis illustrates the economic harm that can occur when predatory financial institutions focus their attention on vulnerable groups like Latinos. In their recent article Latinos Bearing the Brunt of the Foreclosure Crisis, the Center for American Progress reminds us that the housing crisis was particularly hurtful to Latinos, who faced a foreclosure rate of 11.9 percent – significantly higher than the foreclosure rate among African Americans (9.8%) and whites (5.0%).  As the study authors explained: “Latinos were disproportionately targeted for risky subprime loans and were victims of predatory lending practices from major banks, even when their income and credit scores qualified them for a less expensive mortgage.” (p. 2). Although homeownership is recognized as one of the best ways to build wealth and assets, many Latinos lost out on this opportunity because they lacked the knowledge and community resources to insulate them from these predatory institutions.
Educational initiatives designed to train lawyers, business owners and the general public sometimes miss the mark in addressing the legal needs of Latinos.  The traditional law school curriculum may not have the time or resources to provide students the insights that they need to evaluate community needs, especially as it concerns groups like Latinos. Community colleges, chambers of commerce and other community organizations that have more direct contact with the Latino community generally offer seminars or courses on starting a business, marketing strategies, developing a business plan, and accounting principles. Curiously missing, however, is instruction on legal topics designed to protect their personal and business assets. A recent welcomed addition to the metroplex is The Center for Innovation in Arlington, Texas which provides pro bono assistance for patent applications. Hopefully, area Latinos will take advantage of the Center’s support.

New Things That We Learned About Latino Legal Needs

These observations address only part of the story about the legal experiences of Dallas-area Latinos. To fill in the gaps, our firm conducted a scientific poll of 400 Dallas County Latino adults, and discussed the poll findings in a recent report entitled Legal Watch Dallas 2014.  Following are some of the interesting things that we learned about the typical legal experiences of Latinos which expand upon our previous observations. 
·        Name recognition of attorneys or law firms is a problem: Nearly half of the respondents (46.2%) could not recall any name of an attorney, law firm or other organization.  Apparently, over half of Dallas area attorneys are not even on the Latino radar screen in this community.
·        Not all Latinos are looking for a Latino attorney.  About three in ten (31.5%) Latinos had used an attorney or legal service; however, Latinos were just as likely to use Latino attorneys as non-Latino attorneys. Nonetheless, over four in ten foreign-born Latinos (41.0%) believed that a non-Latino lawyer would encounter difficulty understanding the problems faced by their families. By contrast, considerably fewer native-born Latinos (15.9%) felt that this would be a problem.
·        When choosing an attorney, Latinos placed a great deal of importance on trustworthiness and recommendations by friends and family members.  Over eight in ten (83.0%) Latinos felt that an attorney should look like someone that they trust, although only half of the respondents (48.0%) believed that it was important that the attorney be a Hispanic or Latino.  Interestingly, Latinos valued an attorney that was well known, but they were not as impressed that the attorney advertised a lot (32.0%). 
·        The expected legal needs of Latinos included immigration, personal injuries and business matters. Not surprisingly, the study revealed that immigration (42.0%) and personal injuries (34.5%) were high-demand needs for Latinos.  However, a distinct need for legal advice was also apparent for business-related issues like the signing of important contracts (43.0%), setting up a new business (28.5%), a business bankruptcy (14.2%), and obtaining a patent or trademark (13.8%).
·        Personal relationships and web sites were utilized more often than traditional media sources to find information about attorneys. When seeking information about attorneys, Latinos were more likely to rely on family members (74.0%), friends (73.0%), and web sites (57.0%), and less likelyto rely on advertisements on television (35.2%), newspapers (28.8%), radio (28.2%), yellow pages (26.8%) and social media (18.0%).    
·        Family members were the most trusted source of information about attorneys. Nearly four in ten Latinos (39.2%) felt that family members were their most trusted source of information regarding attorneys, followed by web sites (23.2%). The level of trust was distinctly lower for such sources as television ads (9.8%), friends (8.5%), and yellow page ads (3.5%).
·        If needing legal advice today, Latinos were more likely to consult a lawyer or a personal relationship like a friend or family member. Over four in ten (43.8%) Latinos would hire a lawyer if they needed legal advice, while three in ten Latinos (30.5%) would consult a friend or family member. Interestingly, over one in ten Latinos (12.2%) would consult a web site like LegalZoom.com, or visit a legal clinic (9.2%) for those who could not afford a lawyer. 

A Collective Call-to-Action

The poll findings vividly show that the disconnect between Latinos and the legal community has various elements that will likely require the collective action of various organizations to remedy.  These organizations include members of the legal community, community organizations, the media, and family members (see Figure below).  The basic model assumes that Latinos will not be passive participants in this process and will be expected to engage by participating in activities sponsored by these organizations that are designed to familiarize them with the legal protections and instruments that will protect their assets.  

Model of Latino Community Engagement

The legal community, which includes law schools, attorneys, and bar associations, are likely to have the greatest impact.  Law schools should modify their curriculum and require law students to take a course on understanding and communicating with Latinos or other key segments of the community where they plan to practice. Internship experiences could be encouraged with law firms that serve large numbers of Latino clients. Bar associations could offer incentives for its members to serve Latinos with intellectual property concerns.  Practicing attorneys, especially those with specializations in intellectual property, bankruptcies, foreclosures, wills, and other asset protection practices should offer free seminars to educate Latinos regarding some of the basic legal considerations regarding protection of assets.

Community organizations, including chambers of commerce, immigration centers, churches and other non-profits, have the added advantage of being trusted sources among Latinos, which can direct Latinos to credible sources in the community or sponsor seminars where attorneys with the relevant legal experiences can address the fundamental principles of laws that protect their assets.

Media organizations, while not the most trusted sources of information about attorneys, nevertheless reach many Latinos and are effective in making them aware of the legal resources available in their community. Once aware, Latinos will likely seek the approval of family members or other trusted sources before engaging an attorney.

Family members, while not an organization, are nevertheless an important element of the engagement process for legal services. The role of family members can be both negative and positive, of course.  Family members with little or no experience with attorneys may discourage a family member from seeking needed legal advice, or perhaps direct a family member to a “notario” who is not licensed to practice law but may have earned a trusted role in the Latino community.  On the positive side, Latinos that have had some experience using attorneys will be more likely to advise family members to seek legal advice.  When Latinos have little knowledge or experience with the legal system, the role of community organizations becomes even more critical as a trustworthy vehicle that can direct such Latinos to the appropriate legal experts.

Lastly, the Latino individual should be encouraged to seek assistance in matters related to the protection of their assets, and not remain a passive participant in this process. As with many legal matters, Latinos often postpone the engagement of an attorney until something goes wrong – a traffic accident, a personal injury, a deportation, incarceration, etc.  In regards to the protection of assets like intellectual property, wills, and bankruptcy,  Latinos are less likely to be familiar with the consequences of not filing for patents or trademarks, wills or bankruptcy, and may thus lose their assets before an attorney is engaged.  Latino business owners, in particular, should understand that obtaining legal advice on contracts or intellectual property matters should be an essential element of running their businesses.  Interestingly, our own research and experience with Latinos shows that while trust is an essential part of establishing relationships, it is also the case that Latinos can be overly trusting of others and sometimes overlook the need to protect their assets. Such cultural factors need to be a focus of discussion in training activities as well.

In summary, it is my hope that the ideas expressed here will inspire members of the Dallas legal community and our various community organizations to focus their collective talents and engage Latinos with services and programs that will help secure their personal and business assets into the future.
Politicians’ Reckless Disregard for Our Quality of Life
“In politics, an absurdity is not a handicap”

                             — Napoleon Bonaparte
Napoleon’s statement rings true as we witness the series of absurdities that are taking place in Texas today.  Take a few minutes to read about how Texas politicians are prepared to radically change your quality of life.
Legislative Theft:  While the Declaration of Independence guaranteed our right to the pursuit of life, liberty and happiness, Texas legislators apparently see no problem in eliminating this right by supporting legislation that will remove the power of Texas cities to limit the expansion of fracking activities in their communities. Research studies have confirmed the association of fracking activities with earthquakes, their negative impact on roads and highways, contamination of our air quality and water supply, and harmful negative effects to people who are exposed to the dangerous chemicals used in fracking operations. In addition, many areas in Texas are experiencing severe draught while water shortages and restrictions have become commonplace.  Despite this, our lawmakers see no problem in allowing the oil and gas industry to continue their fracking activities which consume millions of gallons of water and are rapidly depleting our scare water resources. This appears to be promoting the pursuit of misery, not happiness.
The New Western World: Thousands of lives are lost to gun violence each year. Rather than limit the spread of arms, Texas legislators are supporting the open-carry law which promises to greatly expand the number of residents that carry guns in public.  Women are often the victims of domestic and gun violence, while national coverage of questionable police shootings show that Hispanics and African Americans are increasingly the victims of trained law enforcement officials that feared for their own safety. Any guess about who will be the likely targets of gun violence by the mostly untrained gun carriers in Texas?  Rather than seek a peaceful resolution of conflicts, Texans may find it more convenient to resolve their conflicts with guns at the slightest provocation to their personal safety.
Mixed Priorities: Politicians like Mayor Rawlings continue to advocate for the construction of expensive toll roads to alleviate transportation problems, despite the absence of community support for such high-ticket investments and evidence that such solutions can also increase traffic congestion.  Such “monuments” can glorify the legacy of a politician’s career but may serve no useful purpose to a community.  With the third highest poverty rate in the U.S. and deteriorating streets that require an estimated $900 million to repair, Mayor Rawlings needs to get his priorities aligned with the desires of Dallas City residents and spend less attention to glorifying his legacy as mayor.  
Dictating Election Outcomes: Strong leaders are needed in many communities, and many centers of leadership excellence have evolved to address this need.  It seems a contradiction, however, for media organizations like the Dallas Morning News to use the power of their influence to discourage voter participation in local elections by declaring repeatedly in their campaign coverage that these aspiring leaders have no chance of being elected. The DMN has spared no effort to glamorize the candidacy of Mayor Mike Rawlings in their news stories, while also describing challenger Marcos Ronquillo as a “long shot” with minimal visibility.  Do we really need the DMN to dictate the mayoral election outcome, and also tell us that the Hispanic community has a short supply of leaders? Moreover, how much trust can we place on polls sponsored by a news organization with such biased viewpoints? The DMN does the best job when reporting the news, not in creating news that is misleading and biased.
 It is lamentable that Texans have grown accustomed to accepting the absurdities that politicians present to us, even when they are clearly harmful to our quality of life. Such absurdities are made more believable by the biased news stories that we read on a daily basis, and reports of substantial campaign contributions from business interests – often the only metrics by which successful campaigns are judged.  Texas residents need to improve their political and environmental intelligence by becoming more informed about the destructive programs and policies that are being supported by our lawmakers, protesting these policies, and forming organized efforts to remove lawmakers who are indifferent to our quality of life in Texas. 
Lawmakers that continue to support public policies that destroy the quality of life in our communities have lost their moral compass, opting instead to reward their campaign contributors and extend their political careers. Texans should not be forced to be the sacrificial lambs, and our children should not be required to inherit the consequences of these absurd decisions
Is Mayor Rawlings Hiding Behind Inflated Satisfaction Ratings of Dallas Residents?
“Dallas residents generally say they’re more satisfied than people in many other cities.” 
According to the Dallas Morning News, that is the response that Mayor Rawlings gave to challenger Marcos Ronquillo during their recent debate at the Belo Mansion when Mr. Ronquillo challenged the Mayor’s misplaced priorities on the Trinity toll road issue. As Mr. Ronquillo asserted, it makes little sense to make such an expensive investment of questionable value given the evidence that the City’s urban core was crumbling – the third highest poverty rate in the nation, a public school system beset by many problems, and thousands of pot holes that residents endure on a daily basis.  But are Dallas residents really more satisfied than people in other cities?  A closer look at how these satisfaction ratings are produced should raise some eyebrows.
We are all accustomed to hearing of efforts to inflate performance ratings – colleges leaving out the test scores of athletes, and school districts omitting or doctoring the test scores of low performers – all efforts to inflate performance and deceive the public. Although less obvious to the public, opinion polling firms also use questionable practices to distort survey results.   In reviewing the survey reports for the City’s satisfaction ratings, it turns out that the ratings are inflated because segments of City residents who are the most likely to receive poor services are excluded from the surveys. Curiously, for several years now the City has awarded the contract for satisfaction surveys to the same survey company that uses the same flawed methodology to produce the same inflated ratings. Really makes you wonder.  The reports are available to the public for their own independent review.

Mayor Rawlings, you owe the public an explanation about the manner in which these satisfaction ratings are produced. More importantly, you cannot hide behind inflated satisfaction ratings that have little credibility.  The public deserves to get a more reasoned explanation about your willingness to overlook the City’s crumbling infrastructure while you continue to promote the questionable investment in the Trinity toll road.
Does Dallas Need a Mayoral Election This Year?
It’s an odd question to ask indeed, but perhaps not so odd if you have kept up with recent news stories about this year’s Dallas mayoral election. Several recent stories in the Dallas Morning News, for example, continue to praise Mayor Rawlings for the programs that have been initiated during his tenure as Mayor of Dallas, and his campaign fundraising success in comparison to his one challenger, Marcos Ronquillo. The DMN has made no secret about its love affair with Mayor Rawlings, and that a second term would be a piece of cake for the mayor. 

But the stories did not stop there. One rather bold DMN columnist stated that “Marcos Ronquillo has a zero chance of being elected” as mayor of Dallas. Yet another story announcing Ronquillo’s candidacy for mayor was placed next to the Obituary section of the DMN.  Of course, this was probably just a coincidence.

While it may be obvious to the Dallas Morning News staff that Mike Rawlings is destined to win the next mayoral election, I believe that Dallasites are smart enough to make up their own minds about who our next mayor should be. With voter turnout rates at historic lows, it doesn’t make sense to discourage voter participation by telling voters that the mayoral election is a done deal.

The voting public needs to understand what the mayoral candidates have in mind for improving the quality of life for City residents. The subjective opinions of media pundits should not substitute for a series of well-planned public debates that would require the candidates to address important issues in their own words. Once scheduled, the candidates should embrace the challenge and not avoid open debate.
Following are a few questions and issues that I would personally enjoy hearing the candidates address in a public debate:

Trinity Tollway: Is there any scientific evidence that Dallas needs the Trinity tollway as a transportation solution? Are there any scientific polls that tell us whether Dallas residents favor or oppose this tollway? Wouldn’t it make better sense to first upgrade our local streets, bridges and highways which are suffering from a lack of maintenance and increasing traffic?
Education: Mayor Rawlings stated in a recent DMN story that Dallasites “do not value education.”  What evidence allows you to make such a profound statement? How does this conclusion fit your role as the self-proclaimed “Education Mayor?” 
Poverty and Unemployment:  Efforts to remediate poverty and unemployment often focus on helping people improve their job skills, business plans or personal skills. However, poverty and unemployment also result directly from the loss of millions of contract dollars that leave the City of Dallas every year to companies located outside of the City of Dallas. These lost dollars contribute nothing to our local economy. Moreover, the City’s poverty rate is among the highest in the nation. As mayor, what plans do you have for awarding more contracts to local business firms and bringing more jobs to City residents?

Fundraising Roadblocks: Current City policy places a $5,000 cap on the amount of funds that a mayoral candidate can raise from any one donor, although the policy does not apply to the incumbent mayor. This policy clearly gives the incumbent mayor a decided advantage in fundraising. How does an incumbent mayor justify accepting donations larger than $5,000 when it clearly creates an uneven playing field for other candidates?

Of course, the notion of not having a mayoral election this year is ridiculous. But equally ridiculous are efforts by the media that discourage voter participation by suggesting that the election outcome has already been determined and that some candidates have a zero chance of being elected. Perhaps the media pundits can find something more useful to do with their time rather than discouraging voters from participating in important elections.

The Texas Recipe for Muting the Hispanic Voice in Public Opinion Polls


If you are a tax-paying Texas resident, should your opinion matter in decisions related to publicly-funded programs or services in Texas?  Of course, you may say, the opinions of all Texas residents are important.  But one Texas state agency thinks that it is acceptable to exclude Spanish-speaking Hispanics from state-funded public opinion polls that are used to decide how tax dollars are spent.  I would like to share the details of an actual case study that vividly illustrates how one Texas agency is being allowed to silence the voice of Texas Hispanics in its public opinion polls.
The State of Texas has plans to spend billions of dollars to improve their transportation system, including the possibility of high speed rail. To ensure that the improved system meets the needs and expectations of Texas residents, the Texas Transportation Institute has the responsibility for conducting important surveys of Texans that reside in specific geographic areas, or corridors, that are likely to be impacted by these improvements.
A recently released report by the Texas Transportation Institute for the first of these two surveys, conducted during the Fall of 2012, provides concrete evidence that the voice of Texas Hispanics was muted by the survey planners.  Indeed, Hispanics represented only 20 percent of the survey respondents, despite their current representation of 38 percent in Texas (American Community Survey, 2011).  Even worse, only 19 percent of the few Hispanics included in the study were interviewed in Spanish – which compares poorly with other state surveys that have shown that 50 to 67 percent of Hispanics prefer a Spanish-language interview.
How could this occur, especially when the study design was reviewed by a “panel of experts” at the Institute?  A careful review of the study methodology reveals several missteps in the planning and execution of this survey:

  • The 16,000 households selected as respondents received only an English-language version of the survey.
  • The cover letter that was included with the English-language survey was provided only in English, and did not offer respondents any support to complete the survey in another language.
  • A question that asked respondents to identify their race-ethnic background provided only one ethnic identifier for Spanish-speaking respondents — “Hispanic” – which could partly explain the under-count of these respondents because other labels are often preferred over the “Hispanic” option.
  • A call center was supposedly set up to receive incoming calls from survey respondents that had questions or needed Spanish-language support. But this call center probably received few calls from Spanish-speaking respondents since the cover letter did not provide the needed contact information.  Moreover, the report did not include a copy of the Spanish-language telephone survey that was supposedly used by the survey vendor’s call center to capture incoming calls by the survey respondents.  
  • The study design required that automated advanced calls (or “robo calls”) be made to the selected households prior to the survey mailing.  Automated calls are a recognized nuisance from telemarketers and political campaigns that often discourage response rates to legitimate public opinion polls.
  • The report indicated that the survey “participation rate” was 34.6 percent – a rate that appears subjectively created and not recognizable by the American Association of Public Opinion Research (2011).  Instead, the overall survey response rate was more likely to be a much lower 9.7 percent (1,559 completions /16,000 invited participants) – not surprising given the recognized shortcomings in the methodology.
  • While the vendor acknowledged that Hispanic respondents were significantly under-represented and non-Hispanic whites were over-represented, no explanation was provided about the potential causes or consequences of this imbalance.
  • The fact that the survey planners ignored a previous warning about the potential flaws in the survey methodology suggests that the poor survey outcomes did not result from just simple carelessness.

         To make matters worse, the same survey vendor was awarded a second contract to conduct another public opinion poll of Texas residents using the same flawed methodology.  Why are state officials allowing such flawed practices to take place, especially at a time when the state’s population is being heavily impacted by the growing Hispanic population?

As one of the vendors that competed for both survey contracts, Rincón & Associates LLC monitored both competitions with some concern. In both competitions, state procurement staff decided to award the contract to the lowest bidder, which may not have been the brightest decision given the poor study outcomes.  As both studies required a mixed-mode survey methodology that few U.S. companies were capable of executing, more weight should have been given to proven experience using this specialized methodology with diverse communities in Texas. Procurement staff did not have to settle for the lowest bidder as other Texas vendors were ready, willing and able to conduct both studies.
Fortunately, an investigation was initiated on March 3, 2013 to find out why a state agency like the Texas Transportation Institute is allowed to deliberately design a study that minimizes the participation of Hispanic residents, especially Spanish speakers.  The outcome of this investigation is important because it could either (a) allow other state agencies to exclude Spanish-speaking Hispanics from state-funded studies, or (b) raise the standards of research for all state agencies to ensure that all state-funded studies provide adequate Spanish-language support.
The practical significance of this issue cannot be over-stated. Spanish-speaking residents are often the most likely to be overlooked in the delivery of public services, the most likely to receive the lowest quality services, and show distinctive attitudes or values that differ significantly from English-speakers.  Thus, excluding Spanish-speakers from opinion polls can lead to more positive satisfaction ratings than is actually the case, and result in erroneous public policy decisions.
It is time to require a higher standard for public opinion polling in communities that are linguistically and culturally diverse. Although professional research organizations have always defined quality and ethical standards for the research industry, it is apparent from the case just discussed that public agencies may not feel the need to follow these guidelines.  Following are a few ideas suggested from our experiences with public agencies like the Texas Transportation Institute:
  • Research firms that compete for opinion polls in the public sector should be required to produce evidence that they have the staff, facilities and past experience to conduct polls in linguistically and culturally diverse communities. If a research firm does not produce a representative sample of such communities in a contracted study, they should not be rewarded with another contract that utilizes the same flawed methodology.
  • The committee members convened by public agencies to evaluate research proposals may not have the expertise to judge these proposals in terms of their adequacy for diverse communities. The inclusion of experts with experience in conducting polls in diverse communities may have prevented the missteps in the Texas A & M studies.
  • In the haste to award a contract to the lowest bidder, proposal evaluators do not regularly check the references provided by the different bidders, but oddly enough still find a way to rate the relevant experiences of the bidders without this information. Prior to contract award, an audit should be conducted to ensure that such references were verified for all of the vendors that submitted a bid in such competitions.

       It is unclear that the State of Texas got the “best value” by selecting the lowest bidder from outside of Texas. Indeed, what is the economic benefit to Texans when a contract is awarded to a non-Texas vendor whose payrolls, taxes and local spending for goods and services will only benefit another state? 

Legislators and advocacy organizations, especially those that represent the needs of Texas Latinos, should show their concern about public opinion polling practices that minimize or eliminate the voice of the constituents that they represent. Can we afford to remain silent on this issue? 
The more conservative members of the Texas community may believe that all public work should be conducted only in English, and that no special accommodations should be made to non-English speakers. Unless we are willing to also exempt non-English speakers from the payment of taxes as well, then I believe that they should be given the option of voicing their opinions on topics that impact their quality of life.  Although many Hispanics and Asian residents have proficiency in English and their native language, about 50 to 70 percent of these residents still prefer to express their opinions in their native language.  By providing the appropriate linguistic options, public opinion researchers are more likely to establish rapport, increase response rates, and obtain more valid responses to their questions from ethnic respondents – all desirable outcomes for high quality research.     
Texas public agencies, especially the Texas Transportation Institute, must be required to raise their standards when conducting opinion polls of Texas residents, and legislators must take a more assertive role to ensure this outcome. We cannot afford to bury our collective heads in the sand on this issue.

National Poll on Arizona’s Immigration Law May Be Misleading

A recent national poll released by the Pew Research Center (5-12-10) reported widespread public support of Arizona’s new immigration law — a resounding 73 percent of the survey respondents! Headlines such as these, reinforced by the scientific credibility of an established polling organization, undoubtedly adds more momentum to the call for similar laws in other states.

Is the national mood really that supportive of Arizona’s new immigration law? Not being one to embrace polling results uncritically, I reviewed the study methodology and discovered that the entire survey was conducted in one language: English. Let me explain why this bias seriously limits the usefulness of the poll results.

Having conducted studies of multicultural populations over the past 30 years, I can assure you that two-thirds of Hispanics and 80 percent of Asians prefer to communicate in their native language when provided the choice. When a poll that includes these segments is conducted only in English, the results are predictable: lower response rates, less valid information, and more missing data. More importantly, because these respondents are more likely to be foreign-born, their exclusion from the Pew study has no doubt also inflated the reported level of public support for Arizona’s new law.

One only has to wonder why the Pew Research Center decided to address such a controversial topic in a manner that silenced the very voices that might have shared a different point of view about Arizona’s new immigration law.

Segmenting Multicultural Consumers: Old Dinosaurs Die Slowly

Eventually, any organization that plans a marketing program comes to grips with the realization that their product or service cannot please everyone. Consequently, the need to define a target segment – those customers whose needs are most likely to be satisfied with a product or service – becomes a critical decision for the marketing program. Indeed, it makes little sense to introduce a product and spend significant advertising dollars only to discover later that the customers that you had hoped would buy the product are not interested.

Although market segmentation is a well-established concept in the marketing world, I am often amazed at the many companies who invest considerable financial resources to launch a multicultural campaign with little more than their own personal insights or advice from ethnic employees to guide these campaigns. To such marketers, segmentation research is not a priority because, for all intents and purposes, ethnic consumers tend to think alike, speak the same language, watch similar media, desire the same products, and shop at similar places. Ironically, when the campaign struggles or just fails, consumers are readily blamed for their lack of interest.

Even marketers who understand the need to segment multicultural consumers have been misguided by the industry’s preoccupation with language segmentation or “language buckets,” as I like to call it. Language buckets are created from responses to questions about the language that a person speaks most often at home. In the case of Hispanics, the language buckets typically used are Spanish all the time, Spanish most of the time, Spanish and English equally, English most of the time, and English all of the time. Marketers often use these language buckets to select a segment of Hispanics that they believe will be more responsive to their advertising campaigns, such as Spanish-dominant Hispanics (i.e., speaks Spanish all the time or most of the time). Despite the often biased and self-serving nature of their research, Spanish-language advocates have been successful in convincing Corporate America to spend nearly 90 percent of all Hispanic-targeted media expenditures on Spanish-language media – quite a remarkable achievement given that 60 percent of U.S. Hispanics are native-born and primarily use English-language media. It is not difficult to understand why some industry stakeholders would not want to change how language segmentation is currently practiced.

Nonetheless, choosing potential customers based on their self-reported home language speaking skills is problematic for two important reasons. First, it makes little sense to select a target segment of consumers based on their language abilities without first determining whether a product or service will meet their needs – like putting the cart before the horse – a practice that overlooks other consumer segments that may also find the product appealing. As a case in point, it seems reasonable to assume that most Hispanic homeowners need home improvement supplies, regardless of their language skills. Rather than focus on Hispanic consumers in a specific language bucket, it makes more sense to identify segments of Hispanic homeowners according to their propensity to buy home improvement supplies, and then design the marketing mix that reaches the desired segments effectively – which may include a combination of English and Spanish-language media. The home improvement company could clearly lose sales if their advertising agency recommended a specific linguistic strategy without first understanding the home improvement needs of all Hispanic consumers and then selecting the most desirable target segment.

Secondly, it is disturbing although not surprising to observe how the marketing industry has embraced such a vague and simplistic concept as home language usage to segment Hispanic consumers. The credit goes to The Nielsen Company for popularizing the use of language buckets to segment Hispanics. Nielsen sponsors national telephone surveys each year of U.S. Hispanics to create the needed information for their television ratings, and shares these universe language estimates with other research firms like Arbitron to compare or adjust their language data on Hispanics.

But the language behavior of Hispanics is not as simplistic as The Nielsen Company would have us believe. Based on various studies of U.S. Hispanics, our research shows that the language that one speaks at home varies considerably within any one Hispanic household – it depends on the subject matter under discussion, the age of the individuals engaged, their country of origin, the task at hand, and general proficiency with the language. In a typical Hispanic household, Spanish or English may be used when talking to specific family members but may take a different path when viewing television, completing homework assignments, listening to radio, playing games, talking to friends, and other activities. Because the language that one speaks at home is influenced by many factors, it lacks the stability needed to reliably segment Hispanic consumers and highly questionable when used to adjust television and radio ratings.

Language usage among multicultural consumers can lead to some unexpected surprises. In recruiting consumers for focus groups, we have learned that consumers who speak proficiently in one language do not necessarily know how to read or write in that language. In telephone interviews, we find that respondents often over-state their proficiency in one language as they try to impress the interviewer with their language skills – a social desirability response set. A more valid and practical measure of language ability can be achieved by being more specific about the language skill needed for a particular task or situation. For example:

  • How often do you speak English when talking to friends?
  • How often do you read Spanish when reading a newspaper?
  • How well did you understand the English-language advice provided by your doctor?

Going forward, I believe that multicultural marketers should re-evaluate their campaigns to ensure that they have taken the appropriate steps to identify their target segment(s), and that their marketing strategies are aligned with the needs of the segments that appear the most attractive. Although language segmentation has been a popular way to identify target segments, the quality of the language data used is suspect and distracts attention away from more useful segmentation bases such as product usage, benefits, and lifestyles. Level of acculturation, which is typically defined by language usage and country of origin, has also been used in the past to understand and segment multicultural consumers; however, it has the same potential as language segmentation to mislead marketers by focusing on a specific linguistic strategy rather than one that is based on product consumption.

Multicultural Research in Need of a Facelift
Over the past 30 years, I’ve conducted my share of multicultural research studies and learned a few things about sound research practices. The elements of sound multicultural research are generally not learned at academic institutions since much of their curriculum and textbooks devote little attention to this topic. Instead, research professionals are more likely to learn through the “school of hard knocks” and may even grasp these elements over time. In my opinion, many research professionals still don’t get it and appear increasingly indifferent to the consequences of their misguided practices. Following is a sampling of some questionable practices that have become rather commonplace in studies of multicultural populations:
  • Incorrect usage of race/ethnic labels to screen respondents
  • The use of monolingual surveys with known bilingual audiences
  • Sample sizes that are too small to detect statistically significant differences
  • Use of online surveys that exclude large proportions of consumers who are not online
  • Consumer segments defined using unreliable language data
  • Over-sampling of foreign-born respondents which leads to biased indicators
  • Interviewers translating questions “on-the-fly”
  • Adjusting survey data with unreliable self-reported language data
  • Use of predictive dialers that lower respondent cooperation rates

One might conclude that these practices are more characteristic of small research organizations with limited resources; large organizations, however, are not immune. J.D. Power & Associates, for example, conducts their U.S. customer satisfaction research in just one language – English – which systematically excludes feedback from many customers who prefer a survey in their native language. Nielsen and Arbitron continue to use self-reported language information to adjust their radio and television ratings, despite evidence that such information is unreliable. Arbitron, in particular, is currently under heavy criticism in regards to their PPM methodology and sampling strategies that allegedly under-estimate Hispanic and African-American radio audiences.

The Census Bureau tells us that by the year 2010, African-Americans, Hispanics and Asians will collectively comprise one-third of the nation’s population – an astonishing 102 million persons. You would think that this seismic demographic transformation would alone motivate industry research organizations to abandon their outdated practices in favor of methods that more accurately capture the experiences of multicultural populations. Unfortunately, that has not been the case.

To get the research industry moving in this direction, we clearly need to expand the dialogue on these issues since academia is moving at a snail’s pace in this arena, too many important deliberations about methodology are taking place behind closed doors, and currently available books on multicultural marketing provide minimal guidance on measurement issues. Thus, I have dedicated this blog as a forum to (a) discuss methodological issues in regards to research with multicultural populations, (b) review selected studies, articles, books, and white papers that address multicultural issues, and (c) create a community of researchers and non-researchers who share similar concerns about the need to improve the quality and transparency of multicultural research. While I do not pretend to know all of the answers to these issues, I will commit to an objective and passionate discussion with members of my blog community.